
Optimization for Sustainable Train Shunting Services Using DMAIC Cycle
by
 , and
, and
Mohammed Alshamlan
, 
Aos Alzahrani
,
Musaad BinYousef
,
Abdelhakim Abdelhadi
,
Khaled Akkad
* and
Rakan Alyamani
Department of Engineering Management, Prince Sultan University, P.O. Box 66833, Riyadh 11586, Saudi Arabia
*
Author to whom correspondence should be addressed.
Sustainability 2022, 14(3), 1719; https://doi.org/10.3390/su14031719
Submission received: 2 January 2022
/
Revised: 27 January 2022
/
Accepted: 30 January 2022
/
Published: 2 February 2022
(This article belongs to the Special Issue Sustainable Operation and Maintenance of Railway Systems)
Abstract
:Railway operations is a complicated field that requires a specialized team to operate trains safely and effectively. The focus of this paper was on a Middle Eastern-based railway company to understand the current train shunting process at the north–south passenger line and investigate possible issues in order to resolve them. The aim of this paper is to go through the DMAIC cycle and use it to define, measure, analyze and recommend improvements to enhance and control the current process. The results show that the bottleneck process can be greatly improved and optimized by fixing the root causes identified by the cause and effect diagram, which should positively contribute to increasing the overall performance of train operations and provide more time to maintain the trains.
1. Introduction
1.1. Background
Established in 2006, the Middle Eastern based Railway Company is the owner and operator of the North Train Railway Network, and now it is the enabler of the railway industry and carries on the vision to build sustainable passenger and cargo transport systems. It has been a story of success for the railway industry.
Taking into consideration the networks that have been established in the past decade, and the magnitude of these projects which are amongst the largest infrastructure developments in the kingdom, it is essential to realize the sustainability effect of such projects. The application of this paper is concerned with railway systems in the Middle East and can be generalized to similar projects. By default, railway systems contribute to the sustainability of Earth’s environment by reducing carbon emissions [1]. The reduction in carbon emissions and industrial pollution through railway system development relies on a proven correlation with decreased personal car usage. In addition, this paper examines the sustainability of the company’s projects by means of applying the define, measure analyze, improve, and control (DMAIC) technique. Achieving sustainability through the application of DMAIC has been proven to be effective in the literature [2]. The company’s trains currently run through three main networks (North—East—West) with lengths of more than 5500 km, through which more than 33 million passengers have been transported. In addition to buses, trains, in general, are considered as one of the important means of public transport on which the DMAIC process can be used.
One of the main services that the company provides is traveling to the far north of its origin country. There are six trains that operate the services of the North Line. On average, there are no more than two out of six trains present at the station. The reason for this is that these are low-speed cross-country trains that are absent from the station for days at a time. These trains travel from the origin city to the destination city—stopping at four different cities en route. The department that is responsible for maintaining the trains is called the Rolling Stock Maintenance (RSM) department. In order to perform the required maintenance for the passenger trains, RSM has five workshops in various locations around the country. One of the main workshops that maintains the north–south trains is the origin city’s North Maintenance Workshop. After each trip, and after the unloading of passengers at the origin city’s North Station, the trains must go back to the workshop for maintenance. This process is referred to as the “Train Shunting Process”. The less time required for the shunting process, the more time the RSM has to maintain the trains. Therefore, it is the company management’s desire to optimize the shunting process by cutting unnecessary movements and reduce time where possible. This paper studies the current standard time the train shunting process takes and compares it with the historical data in order to improve the process and reduce downtime.
The contributions of this paper are as follows:
- Bottleneck processes are identified and measured in the studied railway operation through numerical and statistical methods.
- The bottleneck process is further analyzed through cause and effect to produce an actionable plan for process improvement and sustainable train operations.
1.2. Literature Review
The DMAIC cycle as well as its implementation is a widely popular subject among researchers, who test its effectiveness and range of usage. The effectiveness of DMAIC was explained in [3]. One of the advantages highlighted in this paper was that “DMAIC is in integral part of Six Sigma. It is systematic and fact based and provides rigorous framework of results-oriented project management”.
In the literature, it was highlighted that DMAIC is one of the best tools to improve the processes [4]. In addition, it was explained in a book how the tools of quality improvement can improve the overall enterprise [5]. While the use of DMAIC is currently popularized in many industries, this was not true in the 1940s when it was purely used in the manufacturing industry to attempt to improve the quality of production processes.
One example is a paper where the authors explained how to achieve a company’s goal to increase the overall equipment effectiveness (OEE) using DMAIC and the Failure Mode and Effect Analysis (FMEA) method [6]. This paper showed how the cause and effect diagram and Pareto diagram can be used effectively to identify the bottleneck process and the root causes of issues. The results showed that by applying the DMAIC and FMEA methods, the OEE of a chosen piece of equipment increased from 87% to 92%.
A demonstration of how to use the DMAIC cycle effectively as an element of continuous improvement in practice was carried out by Smętkowska et al. in [7]. This paper simulates the usage of a DMAIC cycle to improve a production process. With time, the usage of the DMAIC cycle expanded to the service industry where processes can be enhanced. In 2018, it was shown that the DMAIC methodology improved and optimized the patients discharge process in hospitals and resulted in a 61% reduction in the cycle times of the process [8]. The application of the DMAIC cycle in the internationalization of higher education institutions was also demonstrated [9]. DMAIC can improve incident investigations, which contributed to the overall safety by fixing the root causes [10]. A demonstration of how DMAIC improved the current processes was presented [11]. In addition, DMAIC improved the overall quality of thermal power plants [12].
The implementation of a Six Sigma approach in the concrete panel production process was presented, which resulted in a positive impact [13]. DMAIC also helped improve the field of medicine. A paper was published presenting the application of the DMAIC cycle to improve quality and reduce costs related to prosthetic knee replacement surgery by decreasing the patient’s length of hospital stay [14]. While DMAIC is a tool, ensuring the usage of it will help in sustaining a lean culture focused on process improvement [15]. This idea of using quality tools to create a culture of improvement was highlighted in a book titled Toyota Production System: Beyond Large-Scale Production [16]. This culture was also highlighted in another book titled The Machine that Changed the World [17].
As a continuation of the above papers, this paper will present the usage of DMAIC cycles in railway services to optimize one of the critical processes that involves many stakeholders, proving that DMAIC can be used in a variety of fields. The remainder of this paper is organized as follows. Section 2 presents the methodology used in this paper where the define and measure phases are elaborated on. The results are detailed in Section 3 of this paper. In Section 3, the analyze phase of the DMAIC technique is implemented. Section 4 outlines the discussion of the determined results. This paper is concluded in Section 5. In the define phase, this paper identifies the problem statement and the scope. In the measure phase, data are collected and basic statistics are performed to help identify the bottlenecks as well as the predictability of shunting process times. The cause and effect diagram will be used on the bottleneck process to identify the root causes as part of the analyze phase. The last two phases were not part of the scope of this paper as they require capital to be raised. However, some recommendations are made to implement the improvement and control the process.
2. Methodology
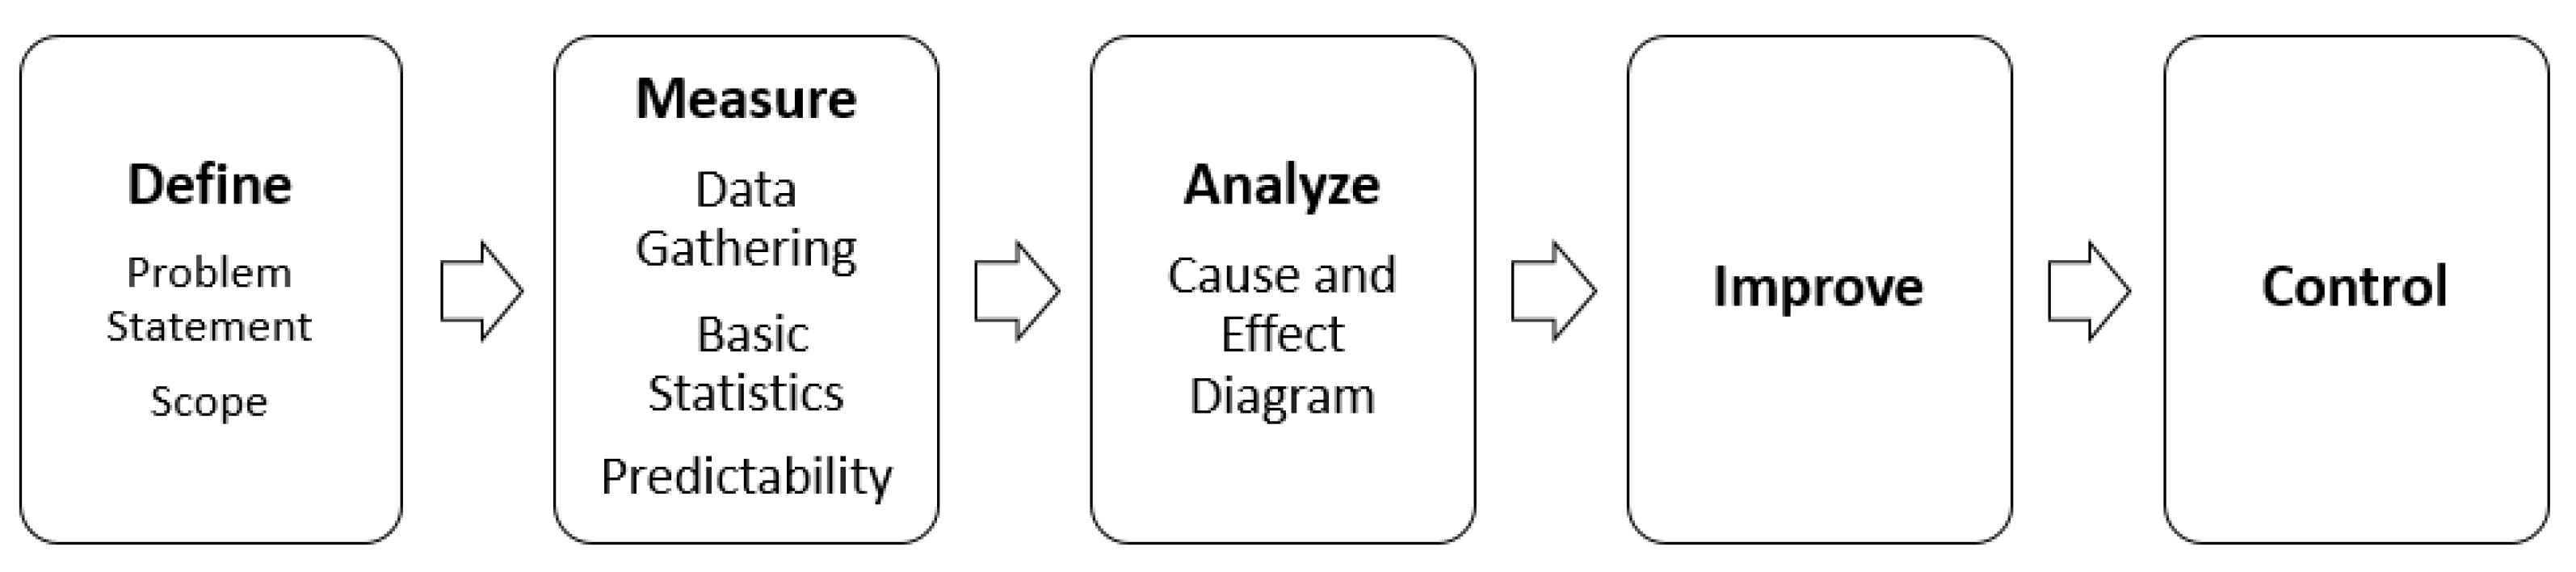
The methodology used in this paper is the DMAIC cycle. The DMAIC cycle is one of the Six Sigma tools that is widely used in many organizations. DMAIC is an acronym for the five phases: define, measure, analyze, improve, and control. This cycle is based on process improvement according to the Deming cycle [3].
The DMAIC cycle can be used in many different areas within an enterprise. It can be used anywhere inside an organization to identify and fix the issues in a data-driven, quality control manner. Figure 1 shows the five phases as well as the tools used in this paper. It is worth mentioning that the work implemented in this paper focuses on the first three phases of the DMAIC cycle.
The DMAIC cycle is applicable to a variety of industries as stated in the literature review section of this paper. The purpose of this paper is to use DMAIC to highlight sustainable practices in train operations. Therefore, the problems are first defined, data are explored and measured, and root causes are analyzed in detail.
The Defining Phase: Problem Statement and Scope
The trains at North-South Services are required to return to the maintenance workshop after each trip where they need to be maintained to be ready for the next service. The origin city’s North Maintenance Workshop is located near the origin city’s station, where the train ends its round trip.
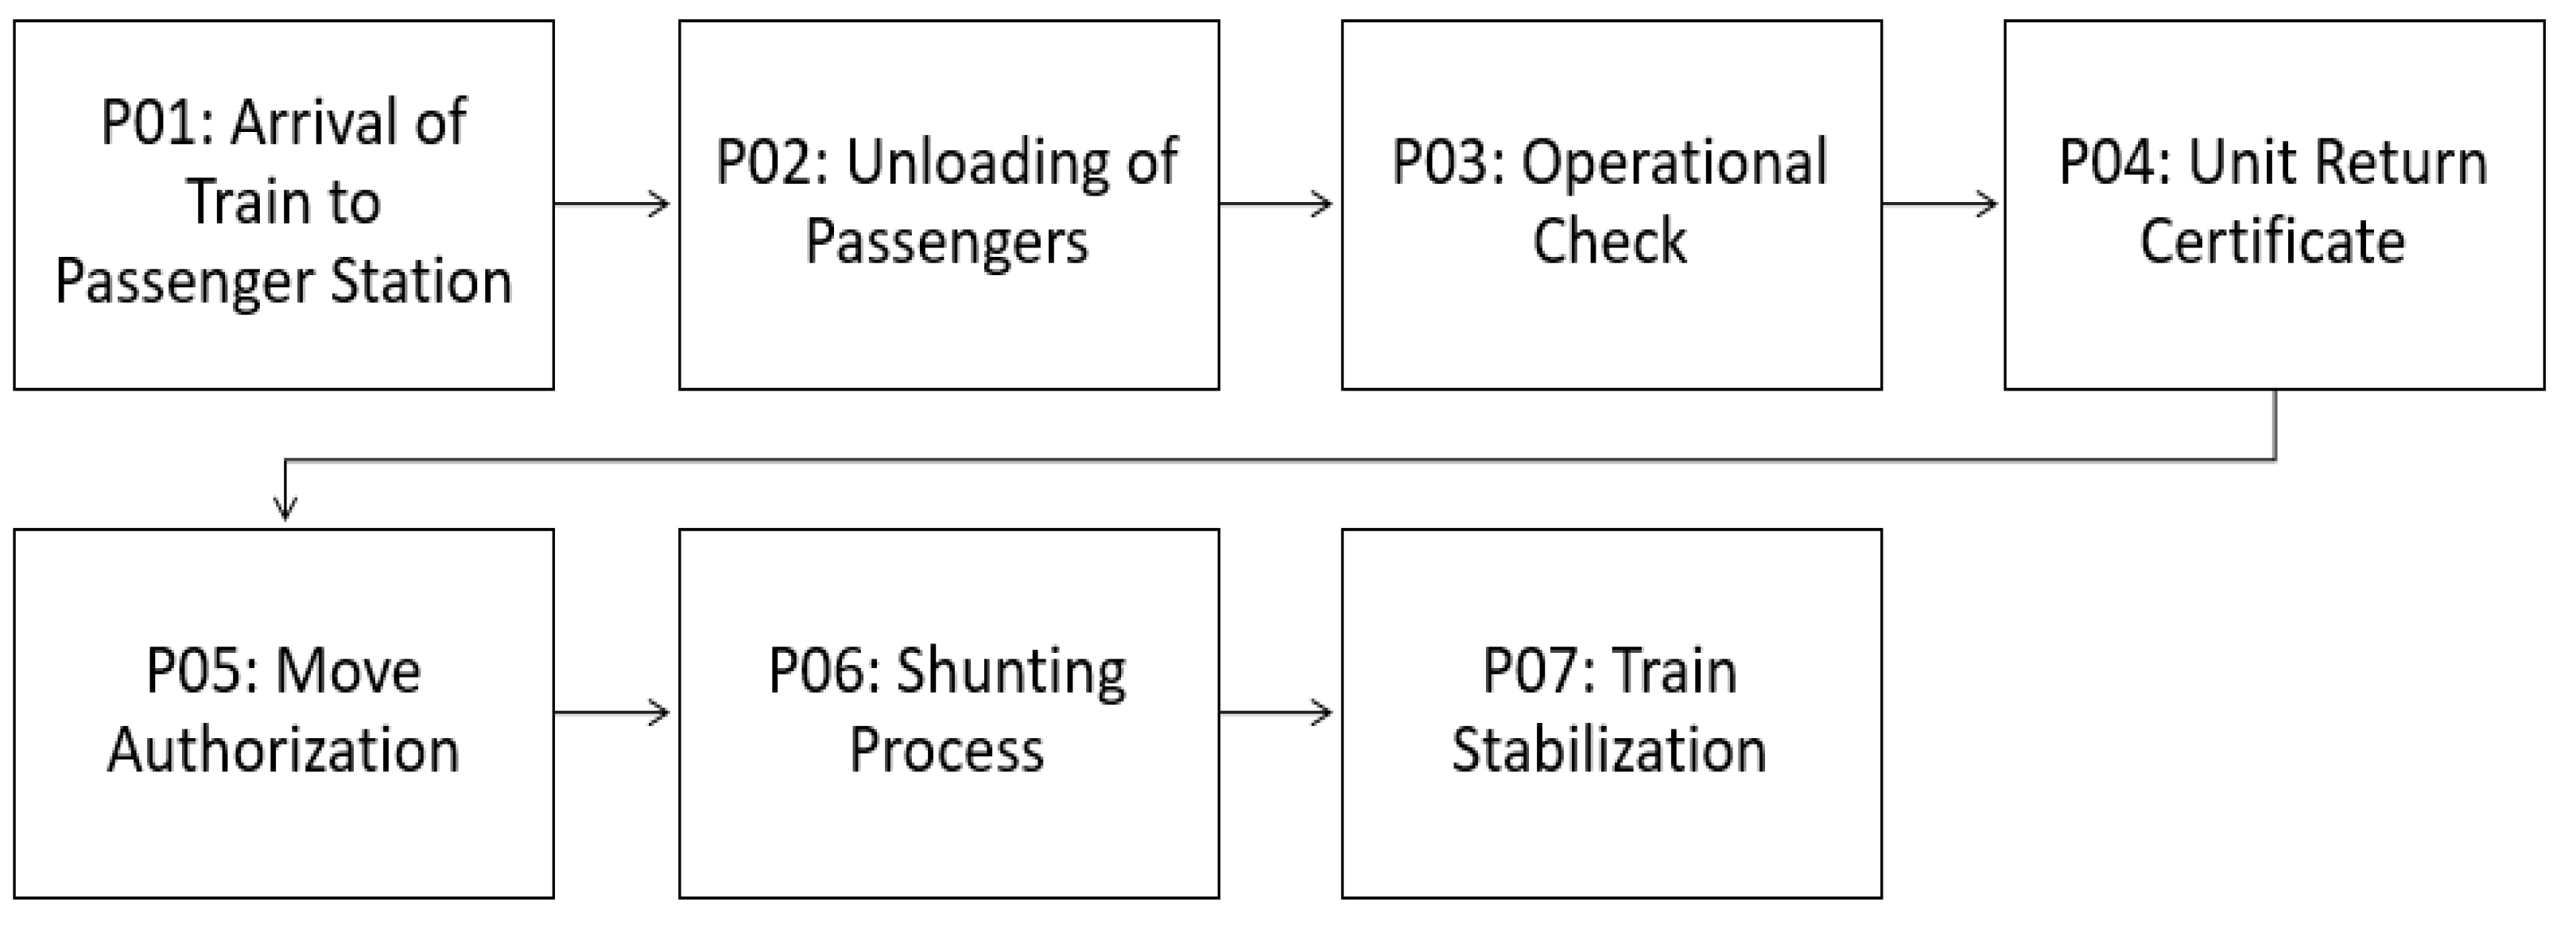
Although the distance is only approximately 0.7 km, the process of bringing the train back to the workshop is not that simple. In fact, in order to complete this task of bringing the train back to the workshop, there are many factors and stakeholders contributing in this process. The current process is shown in Figure 2 and further explained in Table 1.
The official communication between the driver and the OCC is the global system for mobile communications—railway (GSM-R), which is already installed in the power car. GSM-R is a subsystem of the European rail traffic management system (ERTMS). For other communications between the maintenance and operations teams, mobiles and chatting applications are used. ERTMS Level 2 is the system used for signaling and the interlocking system control.
The operational check process is owned by Passenger Operations, which starts after passenger unloading. This involves three parties: (1) the train captain and their operation team ensure that the train is empty and no vandalism has occurred during the trip, (2) the train driver completes all the required documents at the end of each trip, and (3) the onboard technician completes all the service requests and technical checks before the next process, which is the URC process.
Historically, there was a lot of debate on the efficiency of each process. Every stakeholder thought that the tasks they did were efficient and that there were no issues with their processes. Nonetheless, the total processing time was not consistent throughout the years. Therefore, since June 2018, the Performance Department at the Passenger Business Unit has requested that each department measure their processing time for the processes they own and report it on a monthly basis. This step was instigated for a better analysis of the root causes of the issues (if any).
In the beginning of 2021, the RSM Department raised their concerns that they now had much less time to maintain the trains compared to 2018 and 2019. The following are the average processing times/year:
- 2017 (HH:MM) → 03:15;
- 2018 (HH:MM) → 01:46;
- 2019 (HH:MM) → 01:29;
- 2020 (HH:MM) → 02:05;
- 2021 (HH:MM) (first 9 months) → 02:31.
The average processing time per year shows that in 2017 the processing time was high; this is to be predicted as the operations had just started. This time was successfully decreased in 2018. In 2019, the Passenger BU achieved the best average (01:29). However, the time increased in 2020 and kept increasing throughout 2021. Compared to 2019, today the train takes one hour longer to process.
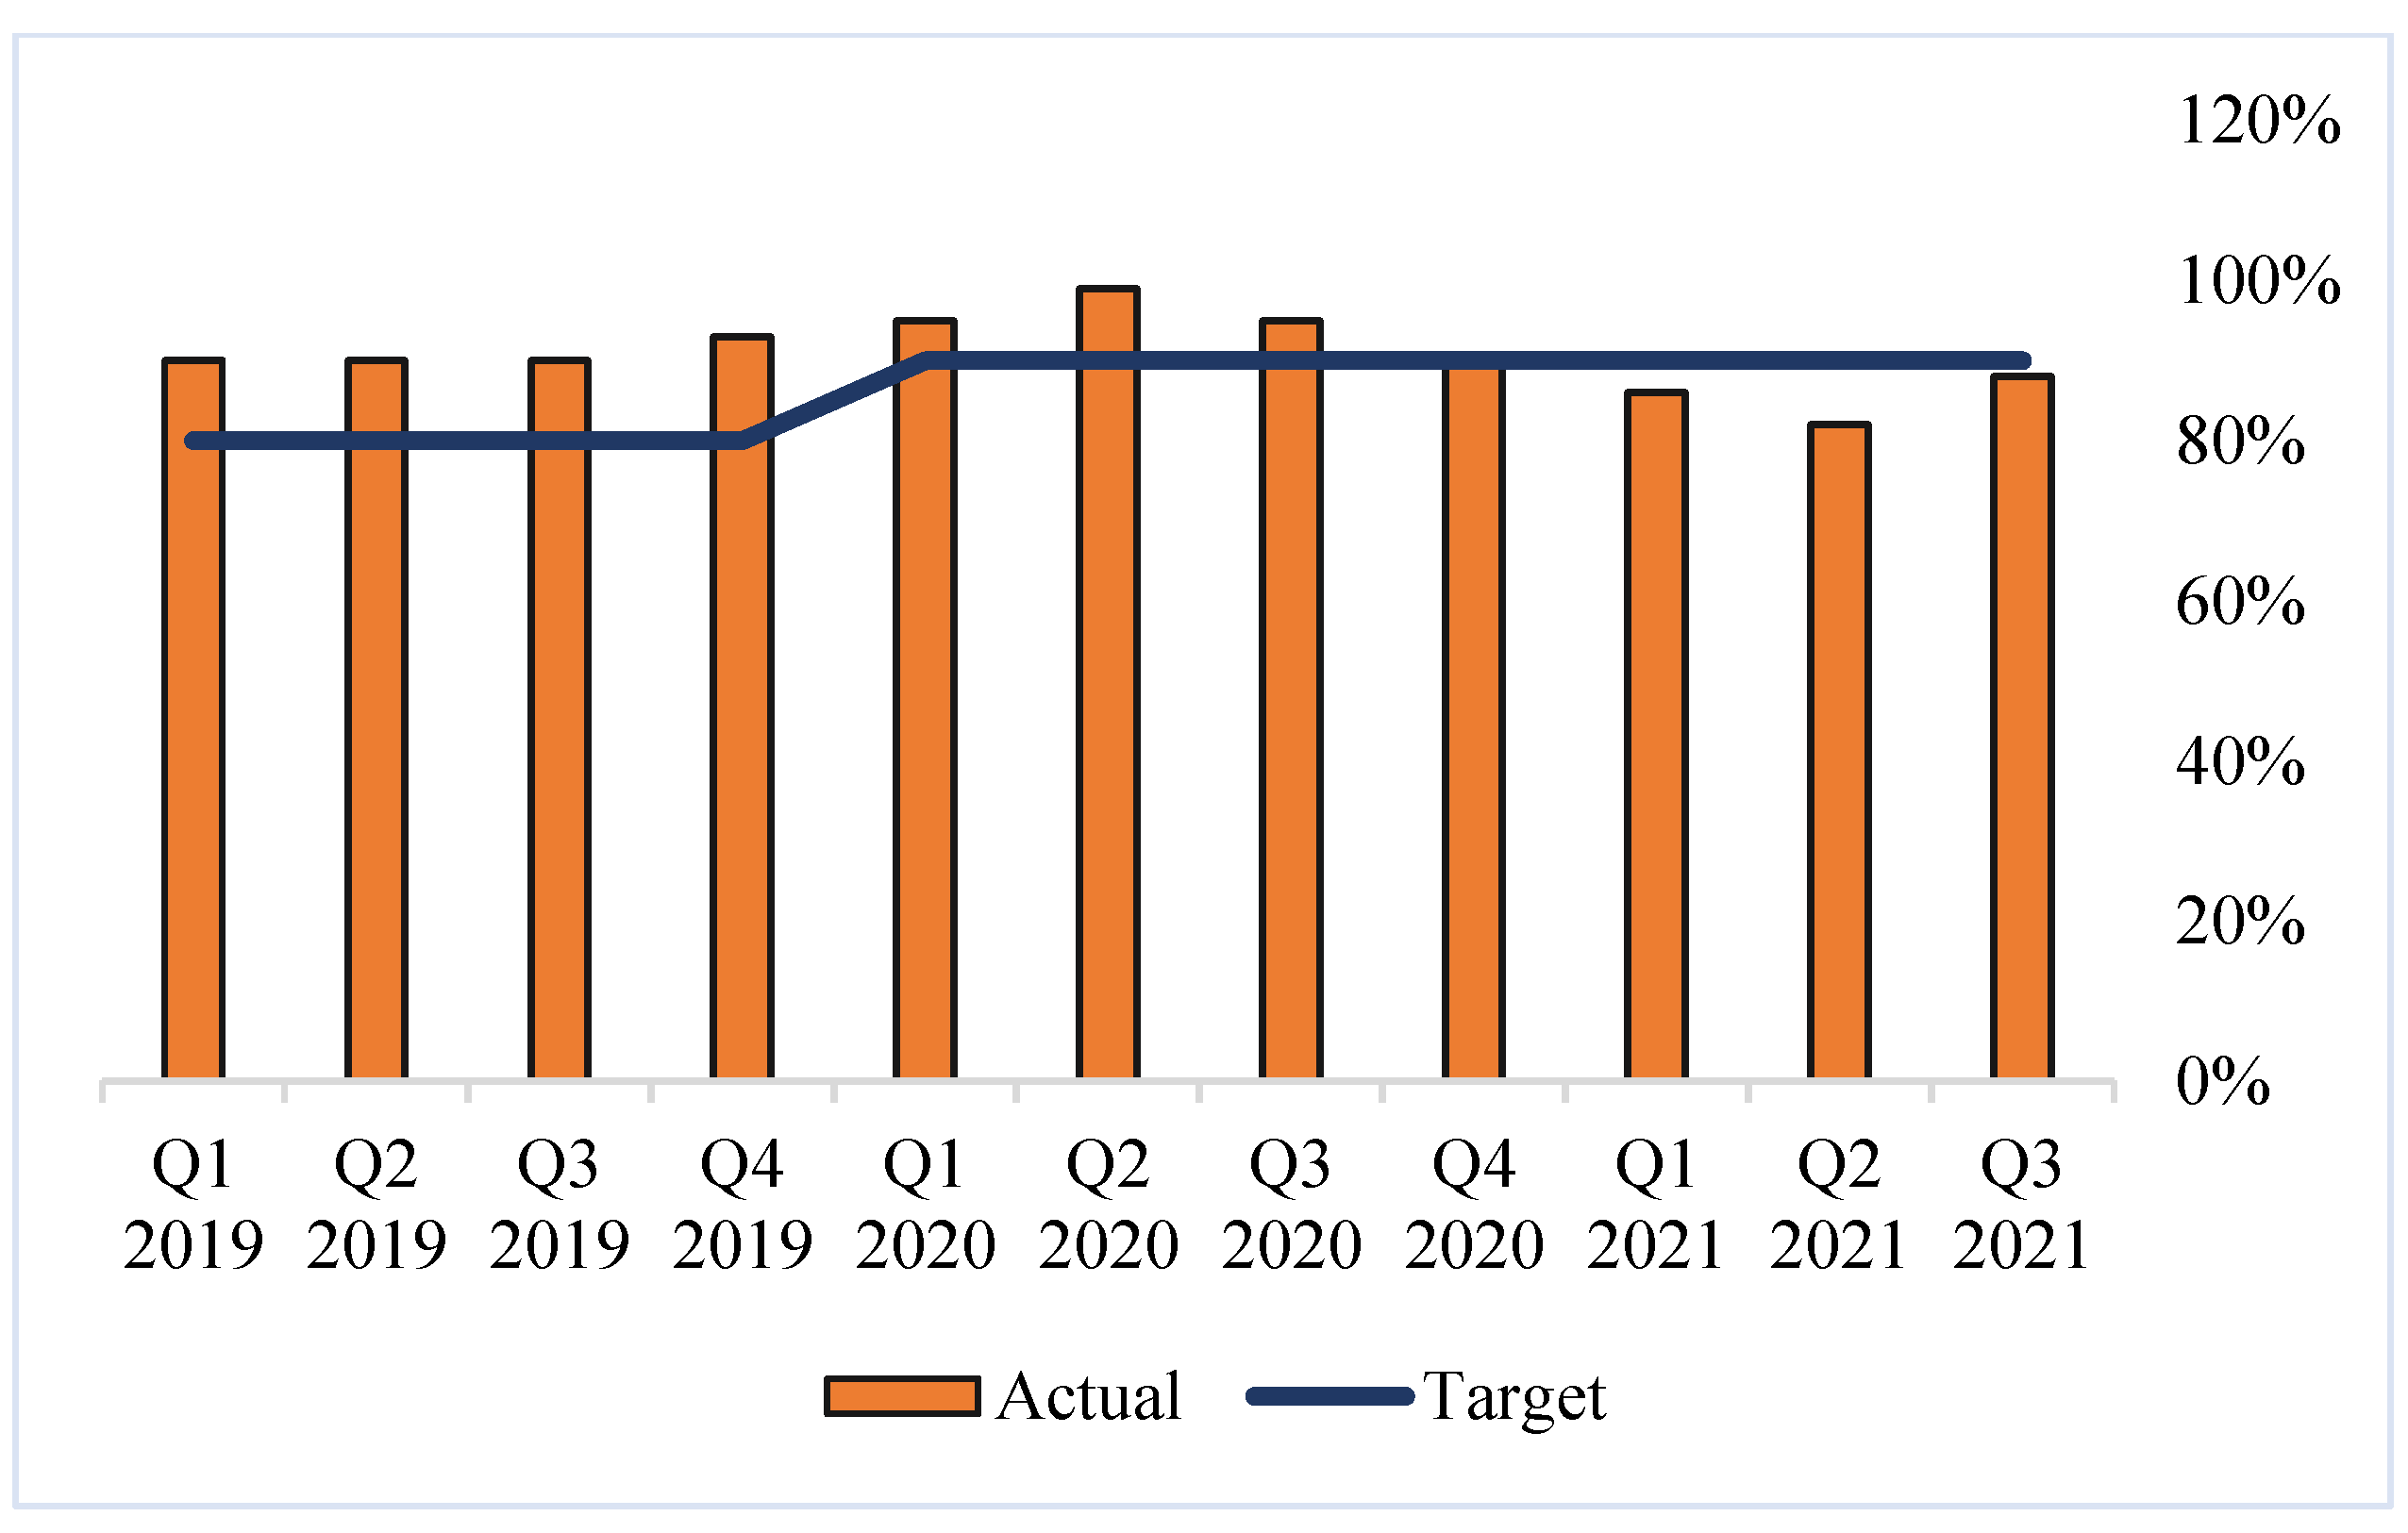
RSM management indicated that in this hour valued work can be conducted, which should enhance the reliability and availability of the trains. In fact, the RSM top management argued that this increase has affected the availability figures negatively in 2021. The effect of the lost hour and the increased services required to fulfill the demand had a negative impact on the availability figures as shown in Figure 3.
While there were many speculations about the causes of the increase, no one has conducted a deep root cause analysis. Therefore, the RSM team requested that they take the lead, represented by the RSM planning function. The Passenger BU agreed and the RSM planning function was assigned to investigate, fix, and test the improved processes, which should return the processing time to its norms.
3. Results
As stated before, since June 2018, the processing time per process has been captured on a monthly basis from each owner and reported in the Passenger BU monthly performance report. The performance team on the Passenger BU has ensured the validity of the data by regular audits to ensure transparency. In addition, the total processing time of the whole process is being reported by the OCC, which gives the performance team a reference point while auditing the reported numbers. Table 2 shows the processing time in minutes/process:
3.1. Measuring Phase
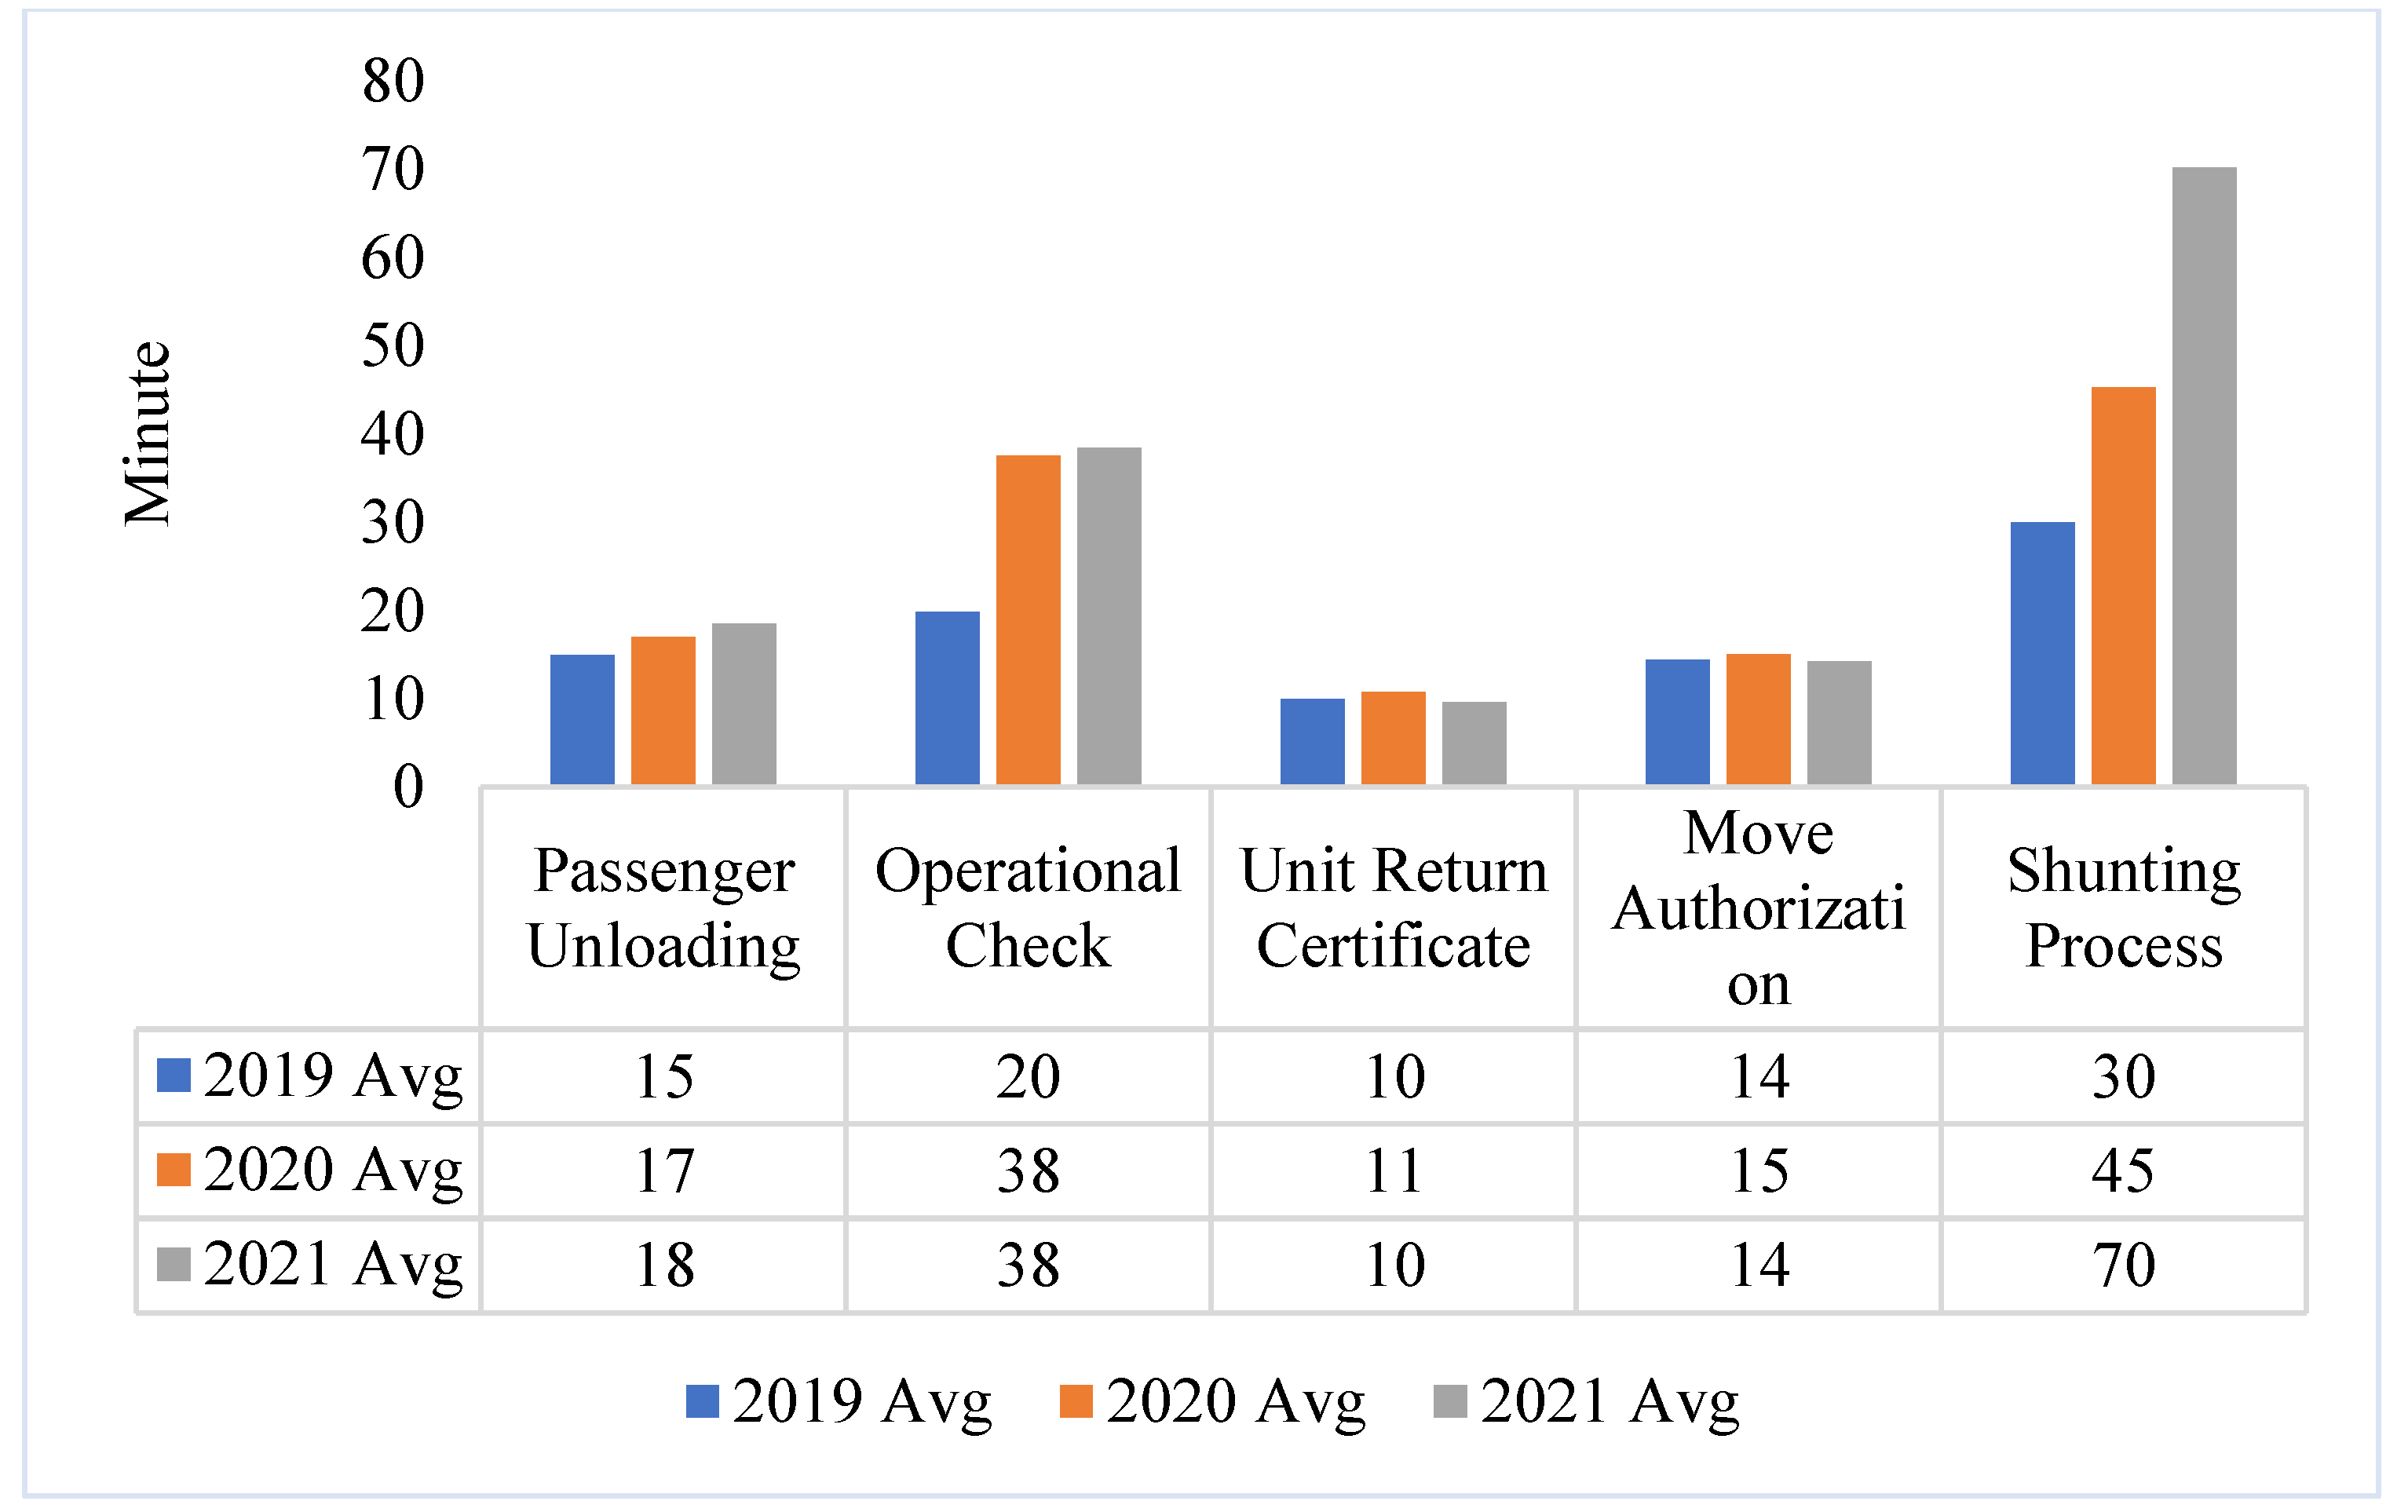
After gathering the data, the next step was to perform comparative testing to identify where the problem was and in which process. The obtained data in a comparative form are shown in Figure 4. The comparative testing shows that there were three processes where processing times increased compared to 2019.
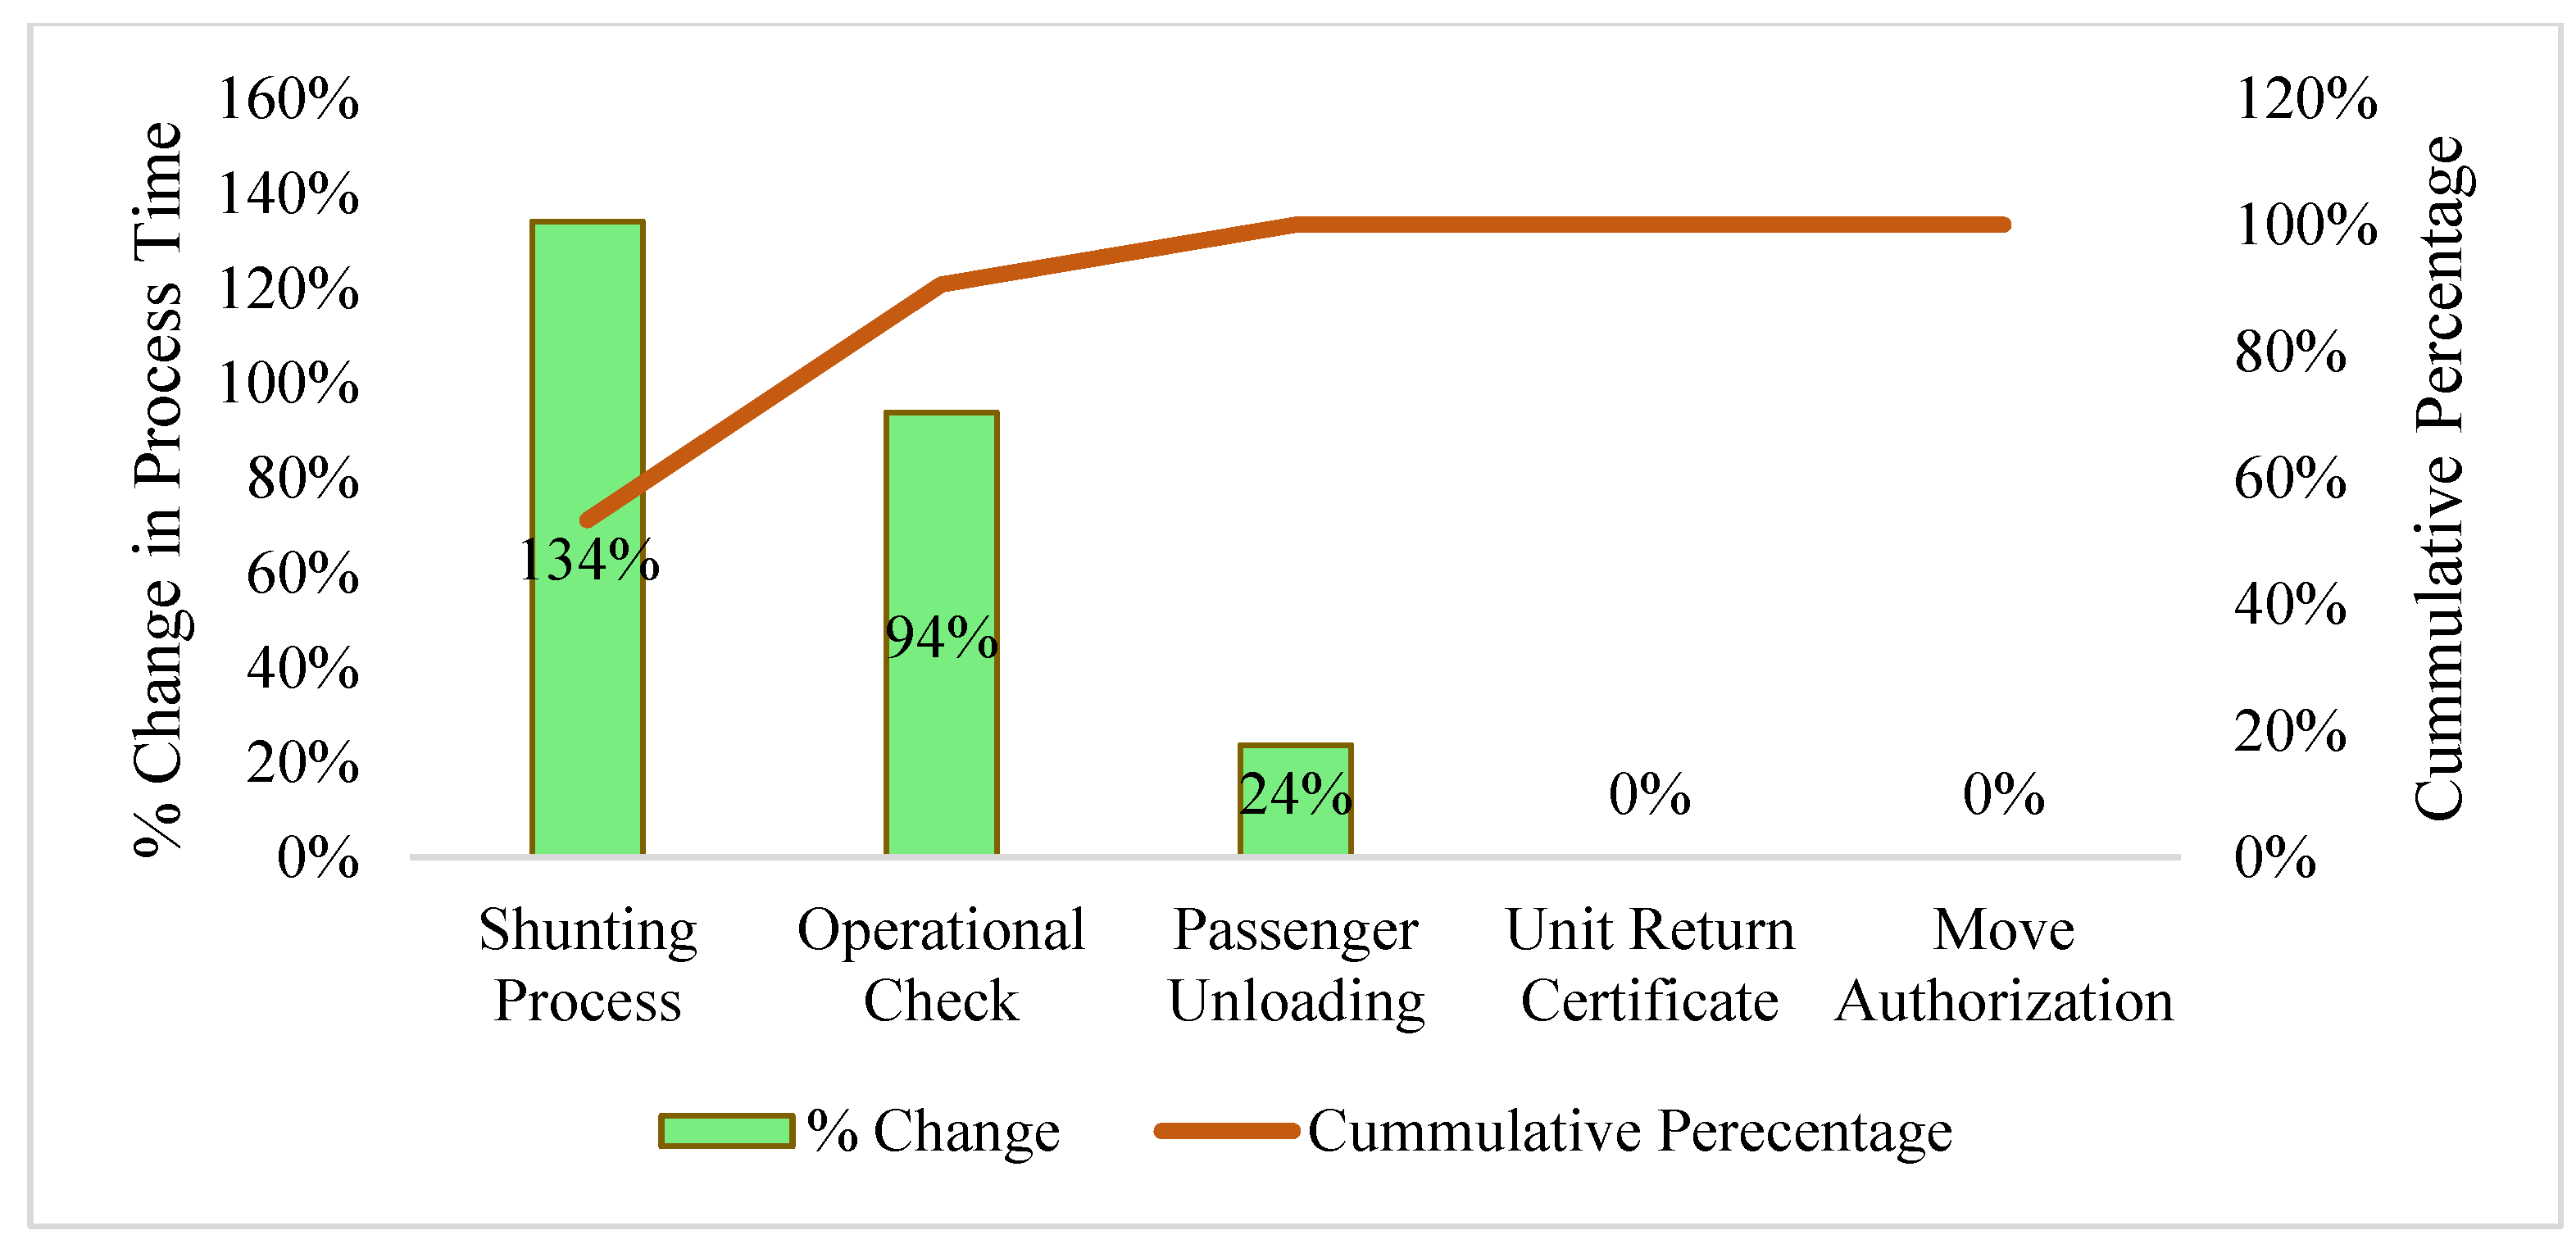
To show the significance of the change (% change) and to highlight the priority of the needed improvement, a Pareto analysis was implemented and is shown in Figure 5. As the Pareto principle states that 80% of consequences come from 20% of the causes, the analysis shows that our 20% of the causes comes from Process 6: Shunting Process. The “Analyze” phase will be conducted for Process 6 to understand the root causes of this delay.
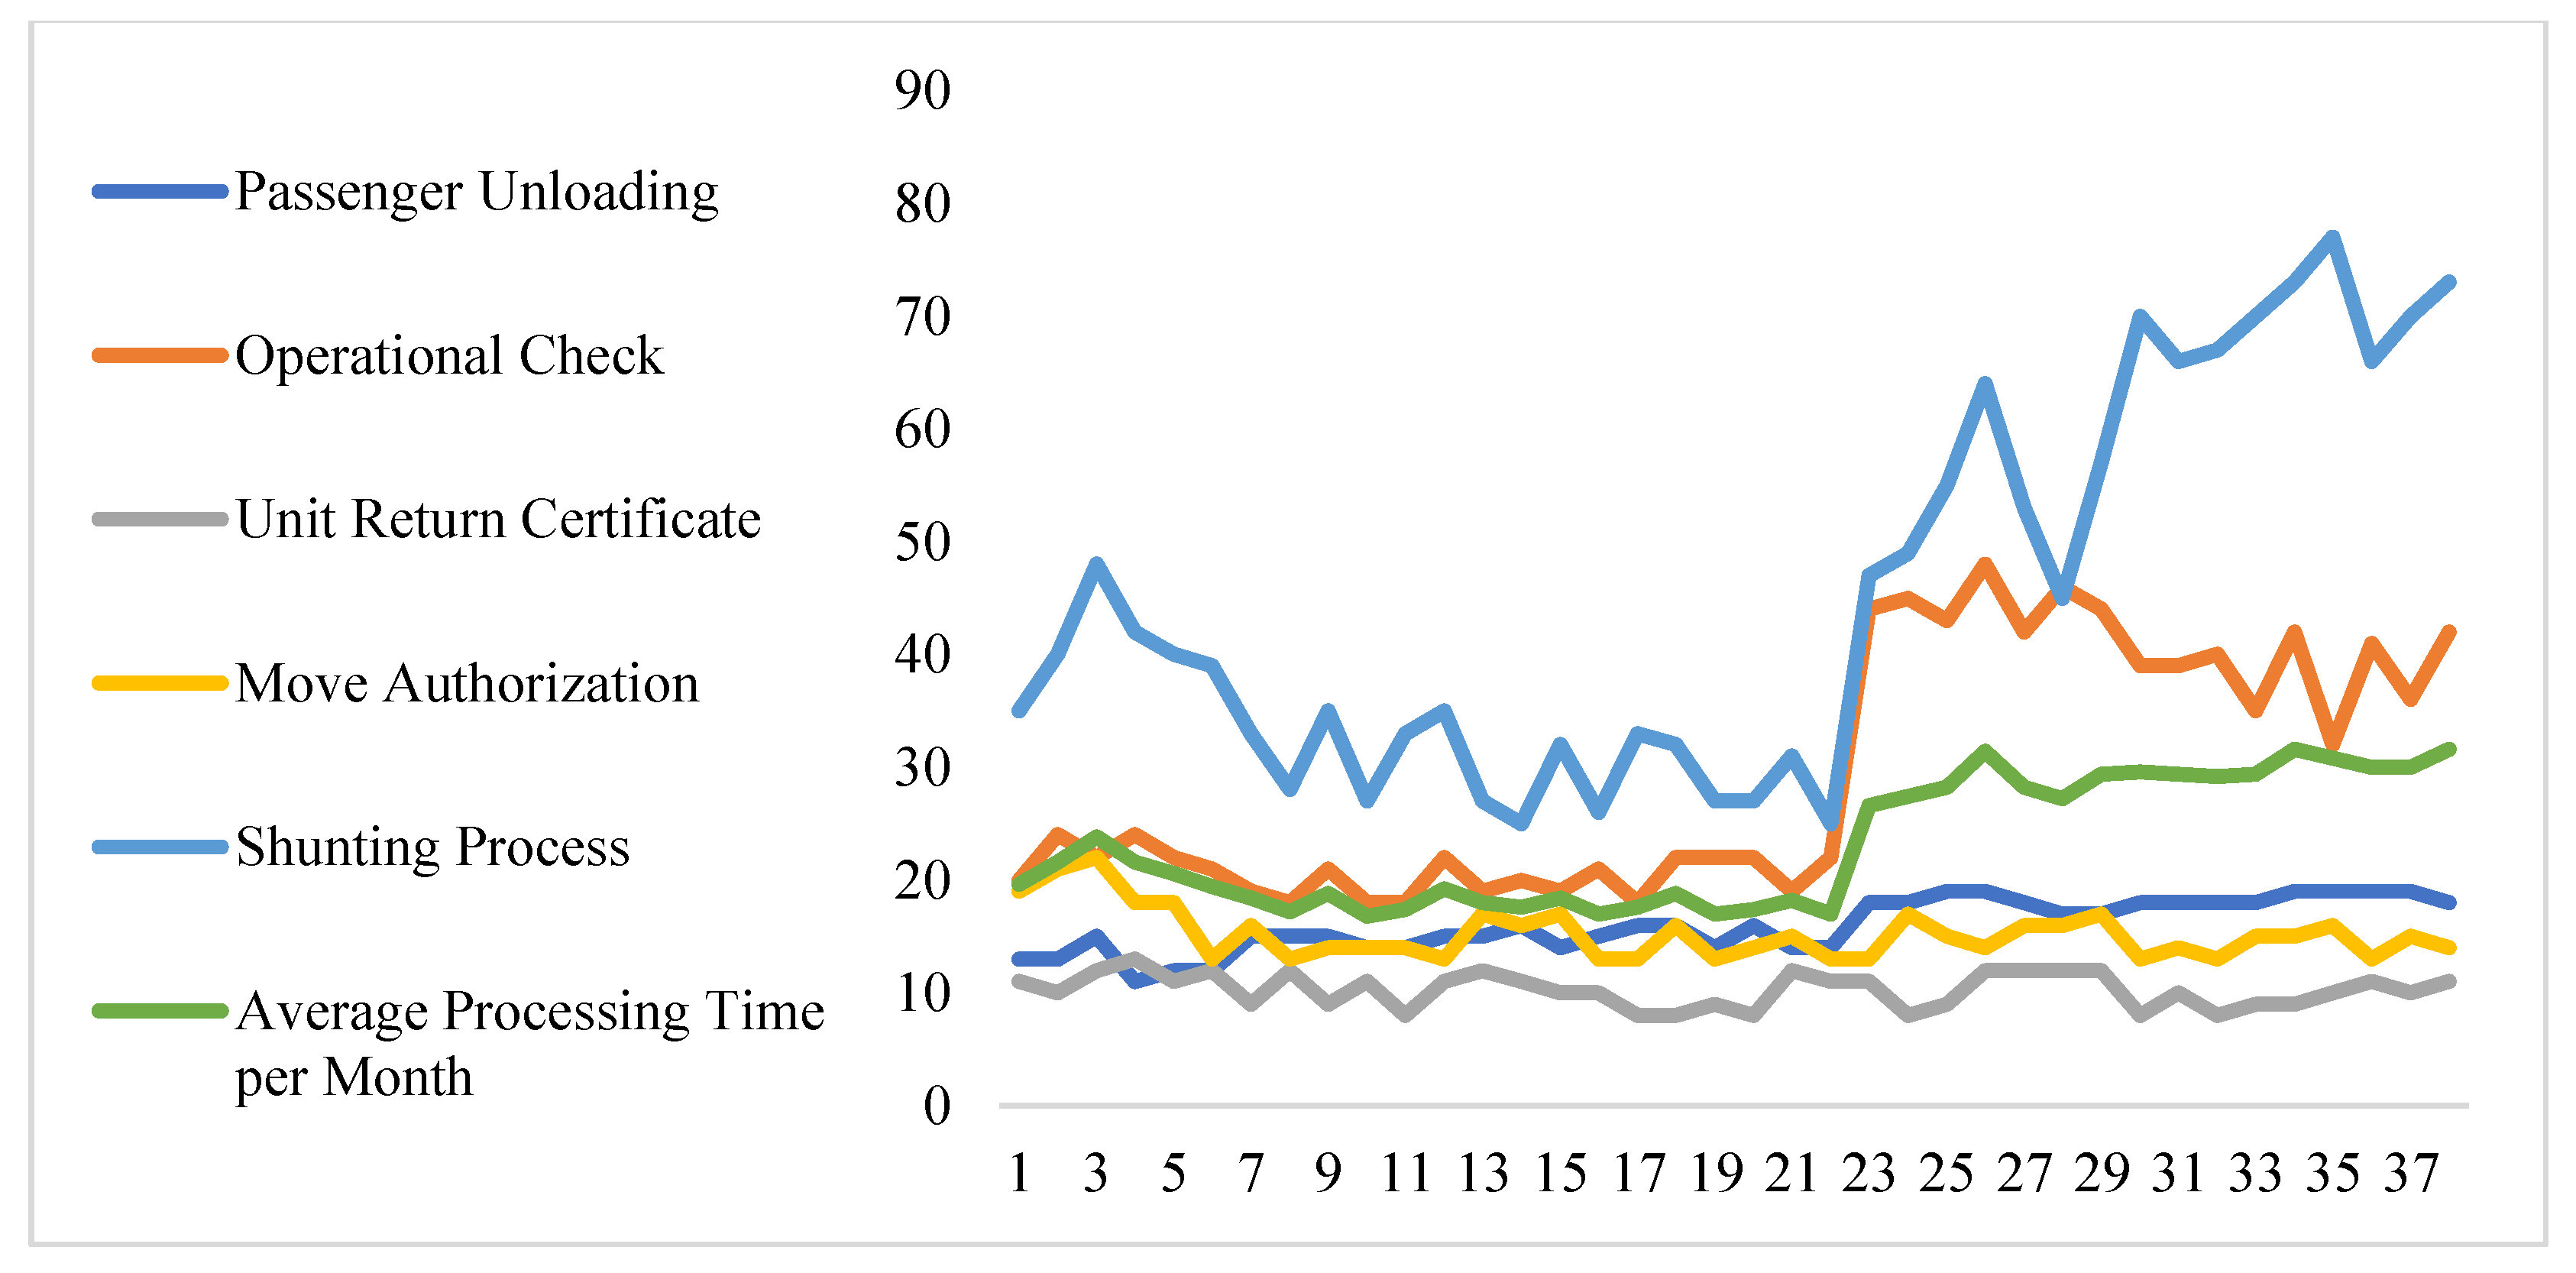
Figure 6 plots the processing times of the five processes over a period of 38 months. It is noted that the shunting process and the operational check are the two processes with the most increased processing times. More specifically, these two processes experience a spike in processing times immediately after the COVID shutdown as noted in Table 2. In addition, Figure 6 shows the average processing time of all processes, which is plotted in green. It is noted that both the shunting and operational check processes are above the average even before the COVID shutdown.
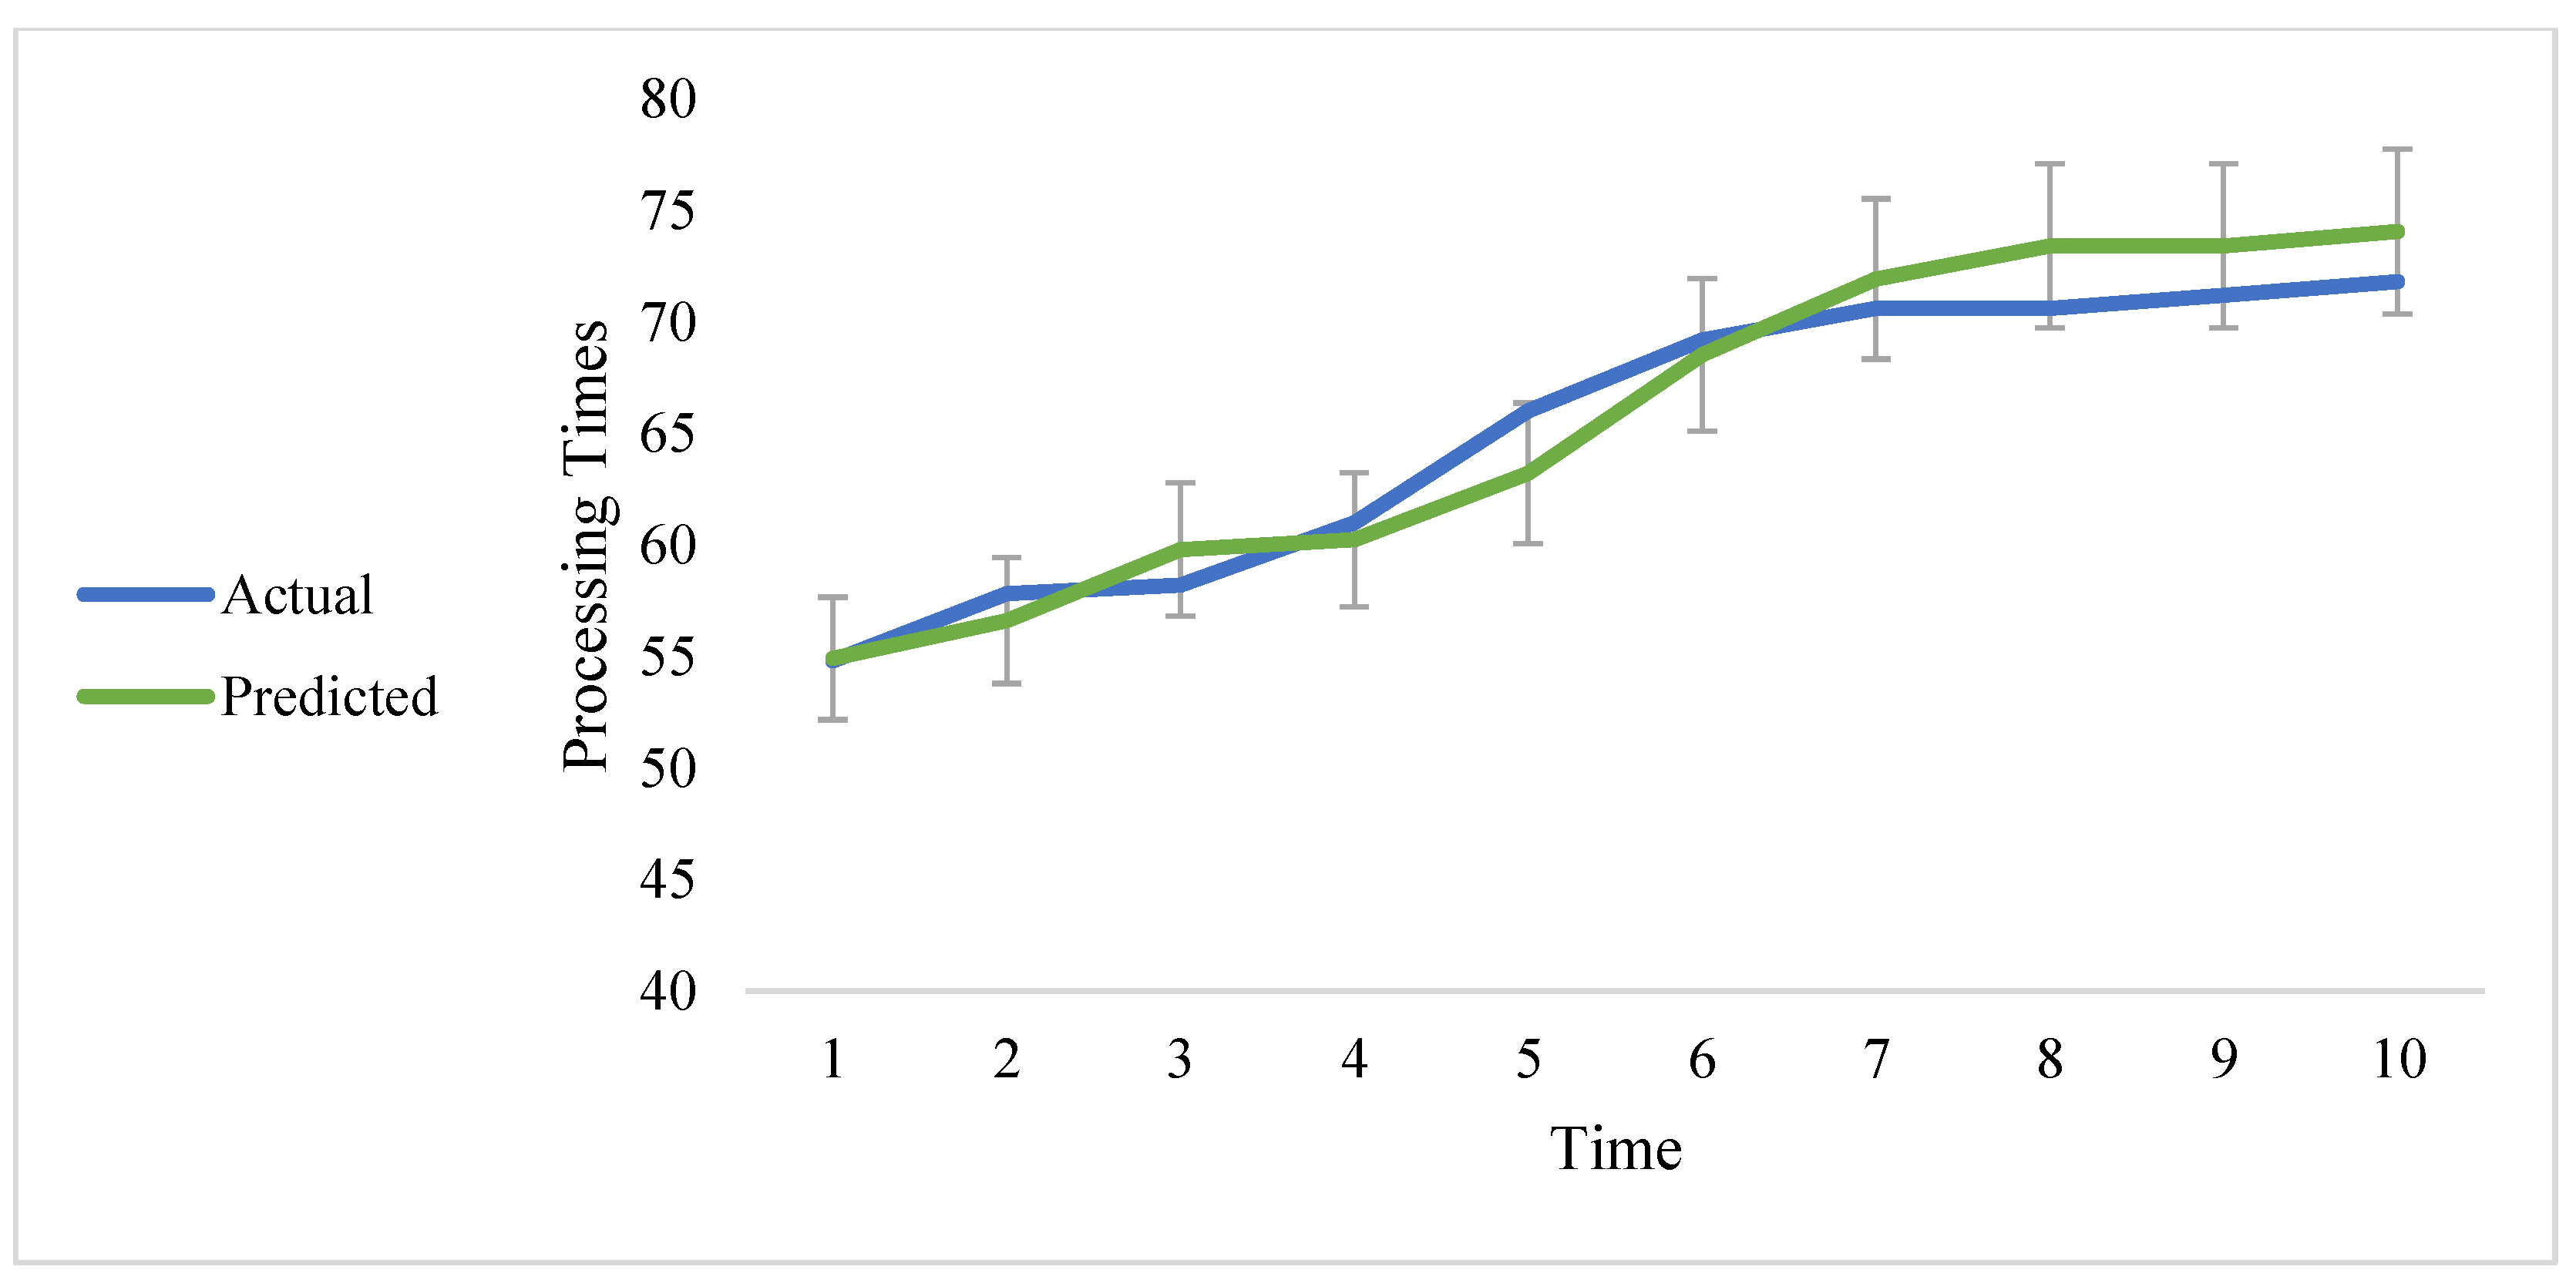
The shunting process, as seen in the previous figures, seems to be the most problematic in terms of processing times. The moving average of the shunting process is calculated and the last 30% is plotted in blue in Figure 7. A simple linear regression [18] predictor algorithm is used to predict the last 30% of the shunting processing times. The first 70% was used as the training data. The algorithm seems to fairly predict processing times within a 5% error margin. The univariate time series is converted into a supervised learning format using an embedding dimension of 1 and a one-step-ahead prediction scheme. It is noted that the more data that are available the more accurate the prediction can be. Therefore, it is recommended that the railway company keeps collecting data for possible use in future predictions.
In addition, the previously mentioned linear regression predictor is used to estimate the two- and three-step-ahead predictions of the shunting process. It is noted that the prediction accuracy decreases relative to the increase in steps. Figure 8 shows the two-step-ahead prediction using the linear regression predictor. The general trend of the shunting processing times is captured using the predictor; however, the accuracy decreases, as shown in Figure 8.
Table 3 shows a comparison of the root mean squared error (RMSE) and mean absolute percentage error (MAPE) among the different number of steps. It is well established that the more steps used, the more useful the prediction can be. The reasoning behind this, especially in maintenance applications, is the fact that an early detection of delays allows for more systematic and planned maintenance tasks. RMSE and MAPE are calculated using the following two equations, respectively:
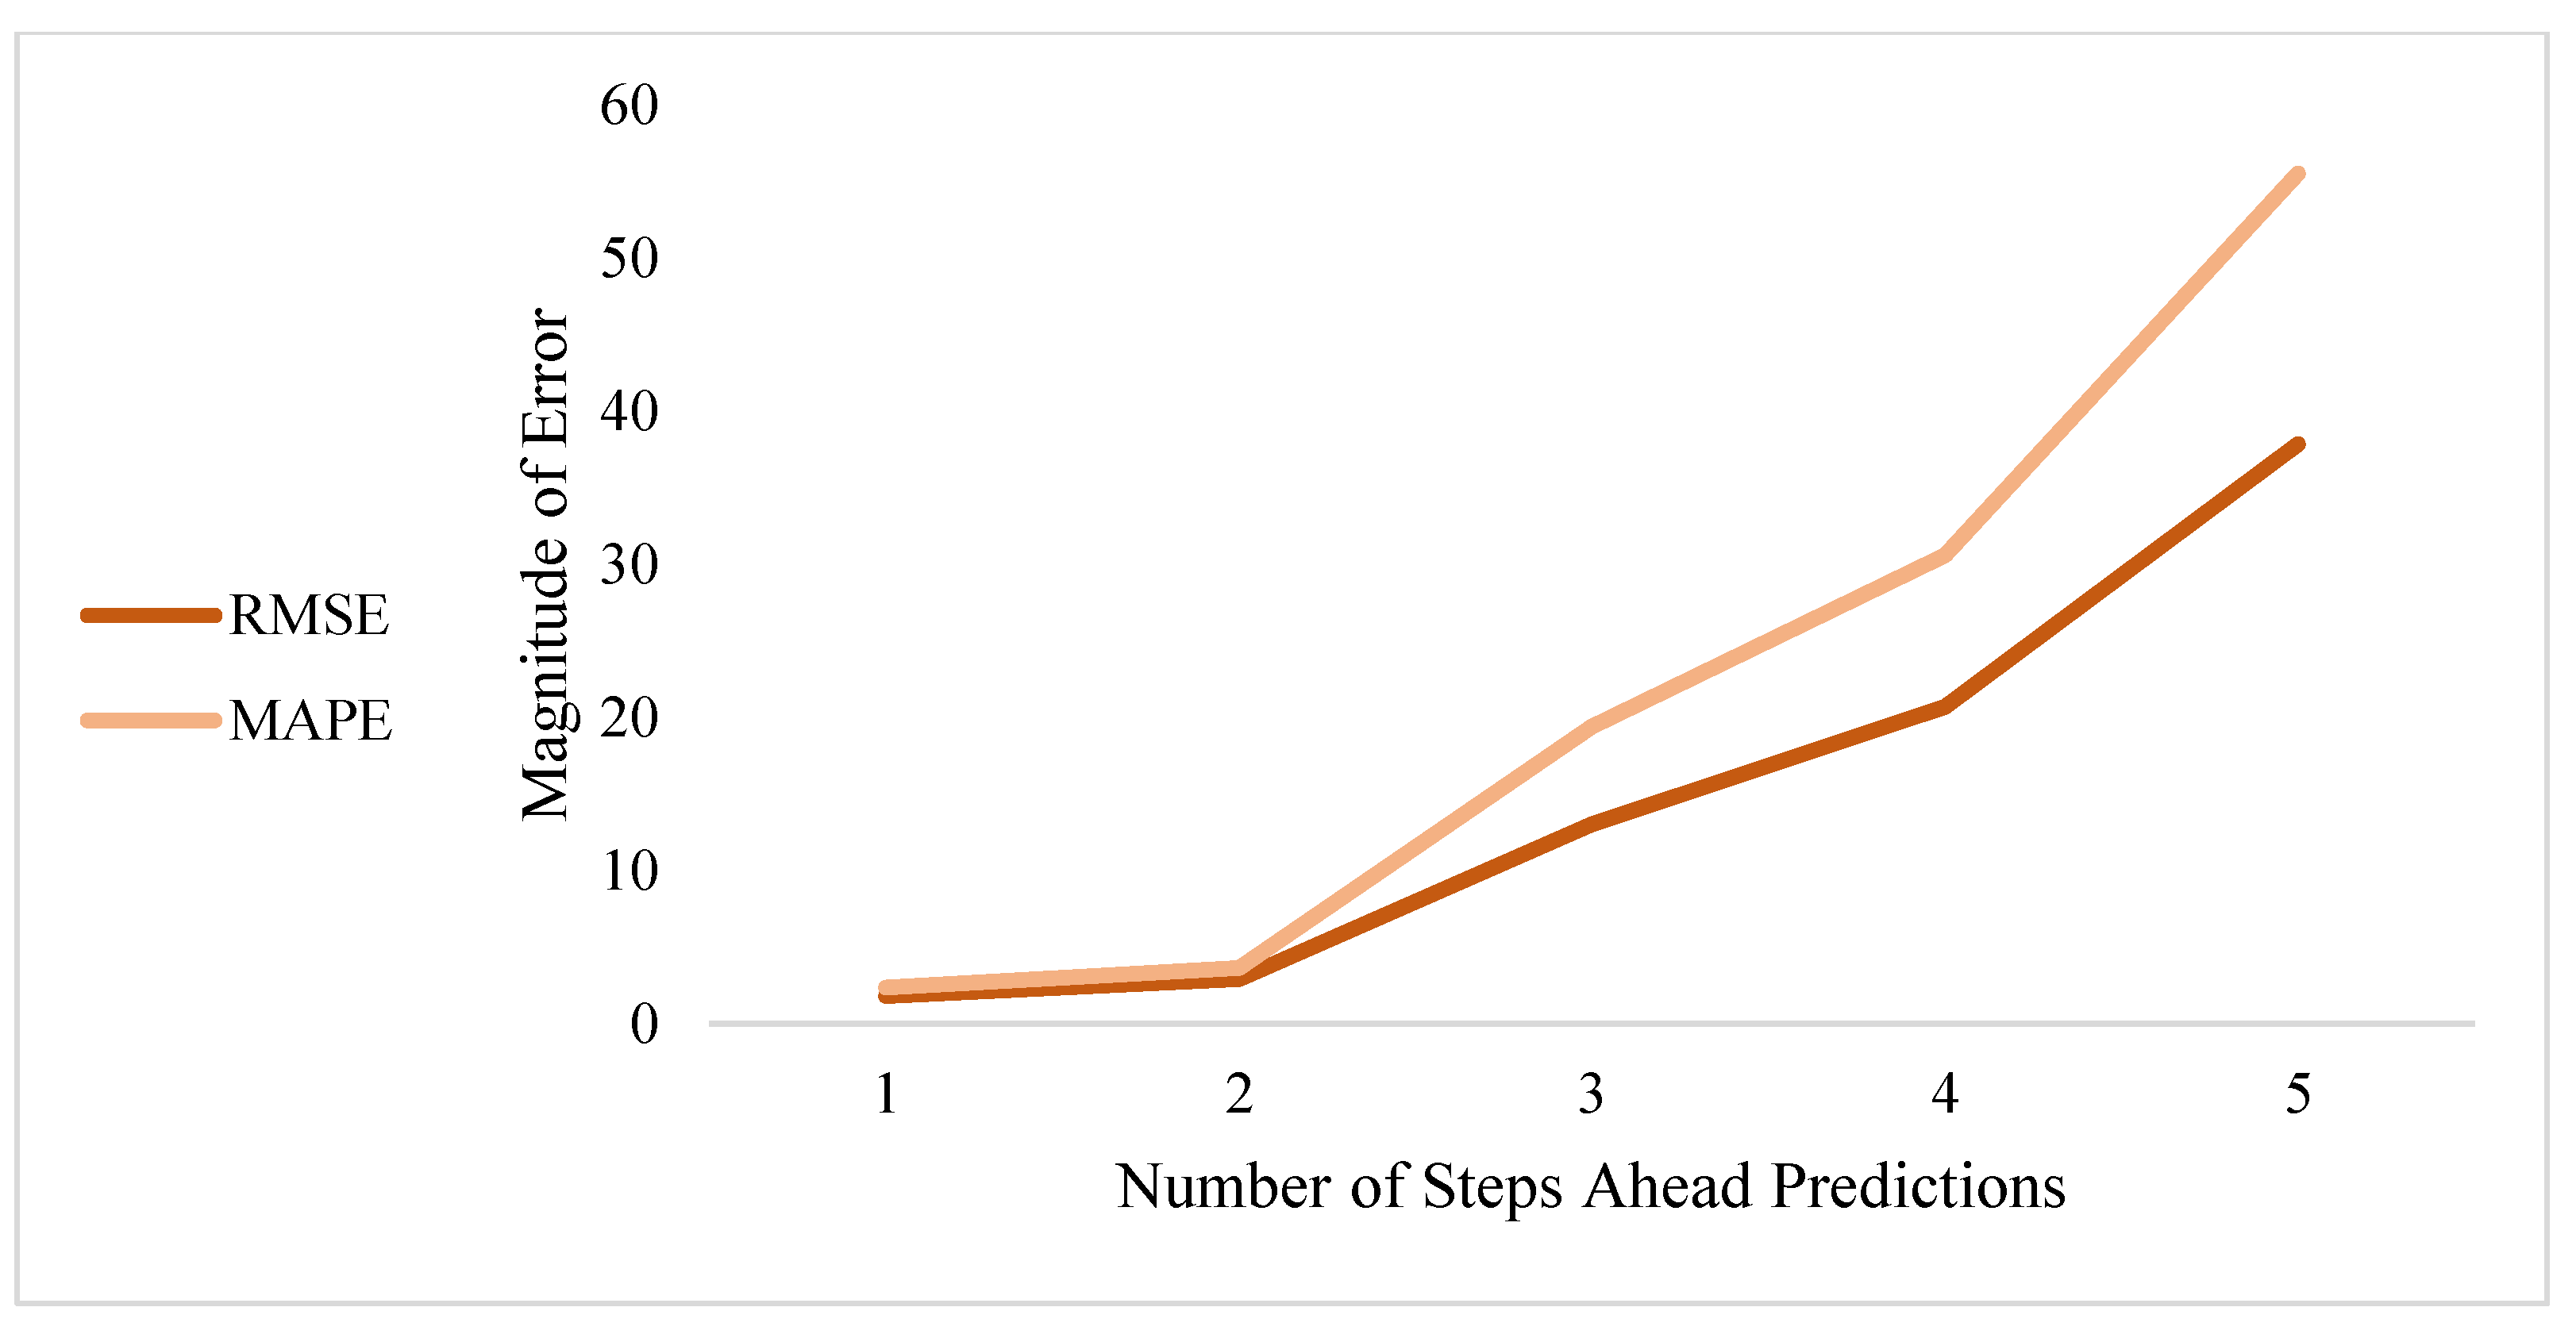
The previous table affirms the need for more data. In order to take advantage of more step-ahead predictions that are accurate, unlike the three- and more step-ahead prediction presented here, more data are needed for training. When moving from two- to more step-ahead predictions, it is noted that there is a significant decrease in prediction accuracy as measured by RMSE and MAPE, the error rates of which are plotted in Figure 9. After sustained data collection, the trained algorithms can be utilized to predict shunting process times in newly established train lines using similar methods.
3.2. The Analysis Phase
After establishing that the shunting process is the most problematic in the system, the determination of causes and effects is crucial to the development of sustainable solutions. Cause-and-effect analysis is highly applicable to most fields in the industry, which is intuitive; nonetheless, examples of applicability are provided. For example, it was shown that a cause-and-effect analysis is beneficial in sustainable supply chain competitiveness [19]. In addition, transportation safety management is one the fields in which cause-and-effect analysis is highly used [20]. The cause-and-effect scheme is also evident in fields such as sustainable solid waste management [21]. Marketing is one of the business fields that heavily relies on cause-and-effect analysis [22,23,24]. The goal here is to demonstrate the widespread applicability of cause and effect across disciplines. For this reason, a specific cause-and-effect scheme is used in this paper. More importantly, a cause and effect analysis is especially implemented in railway systems all over the world [25,26,27,28,29].
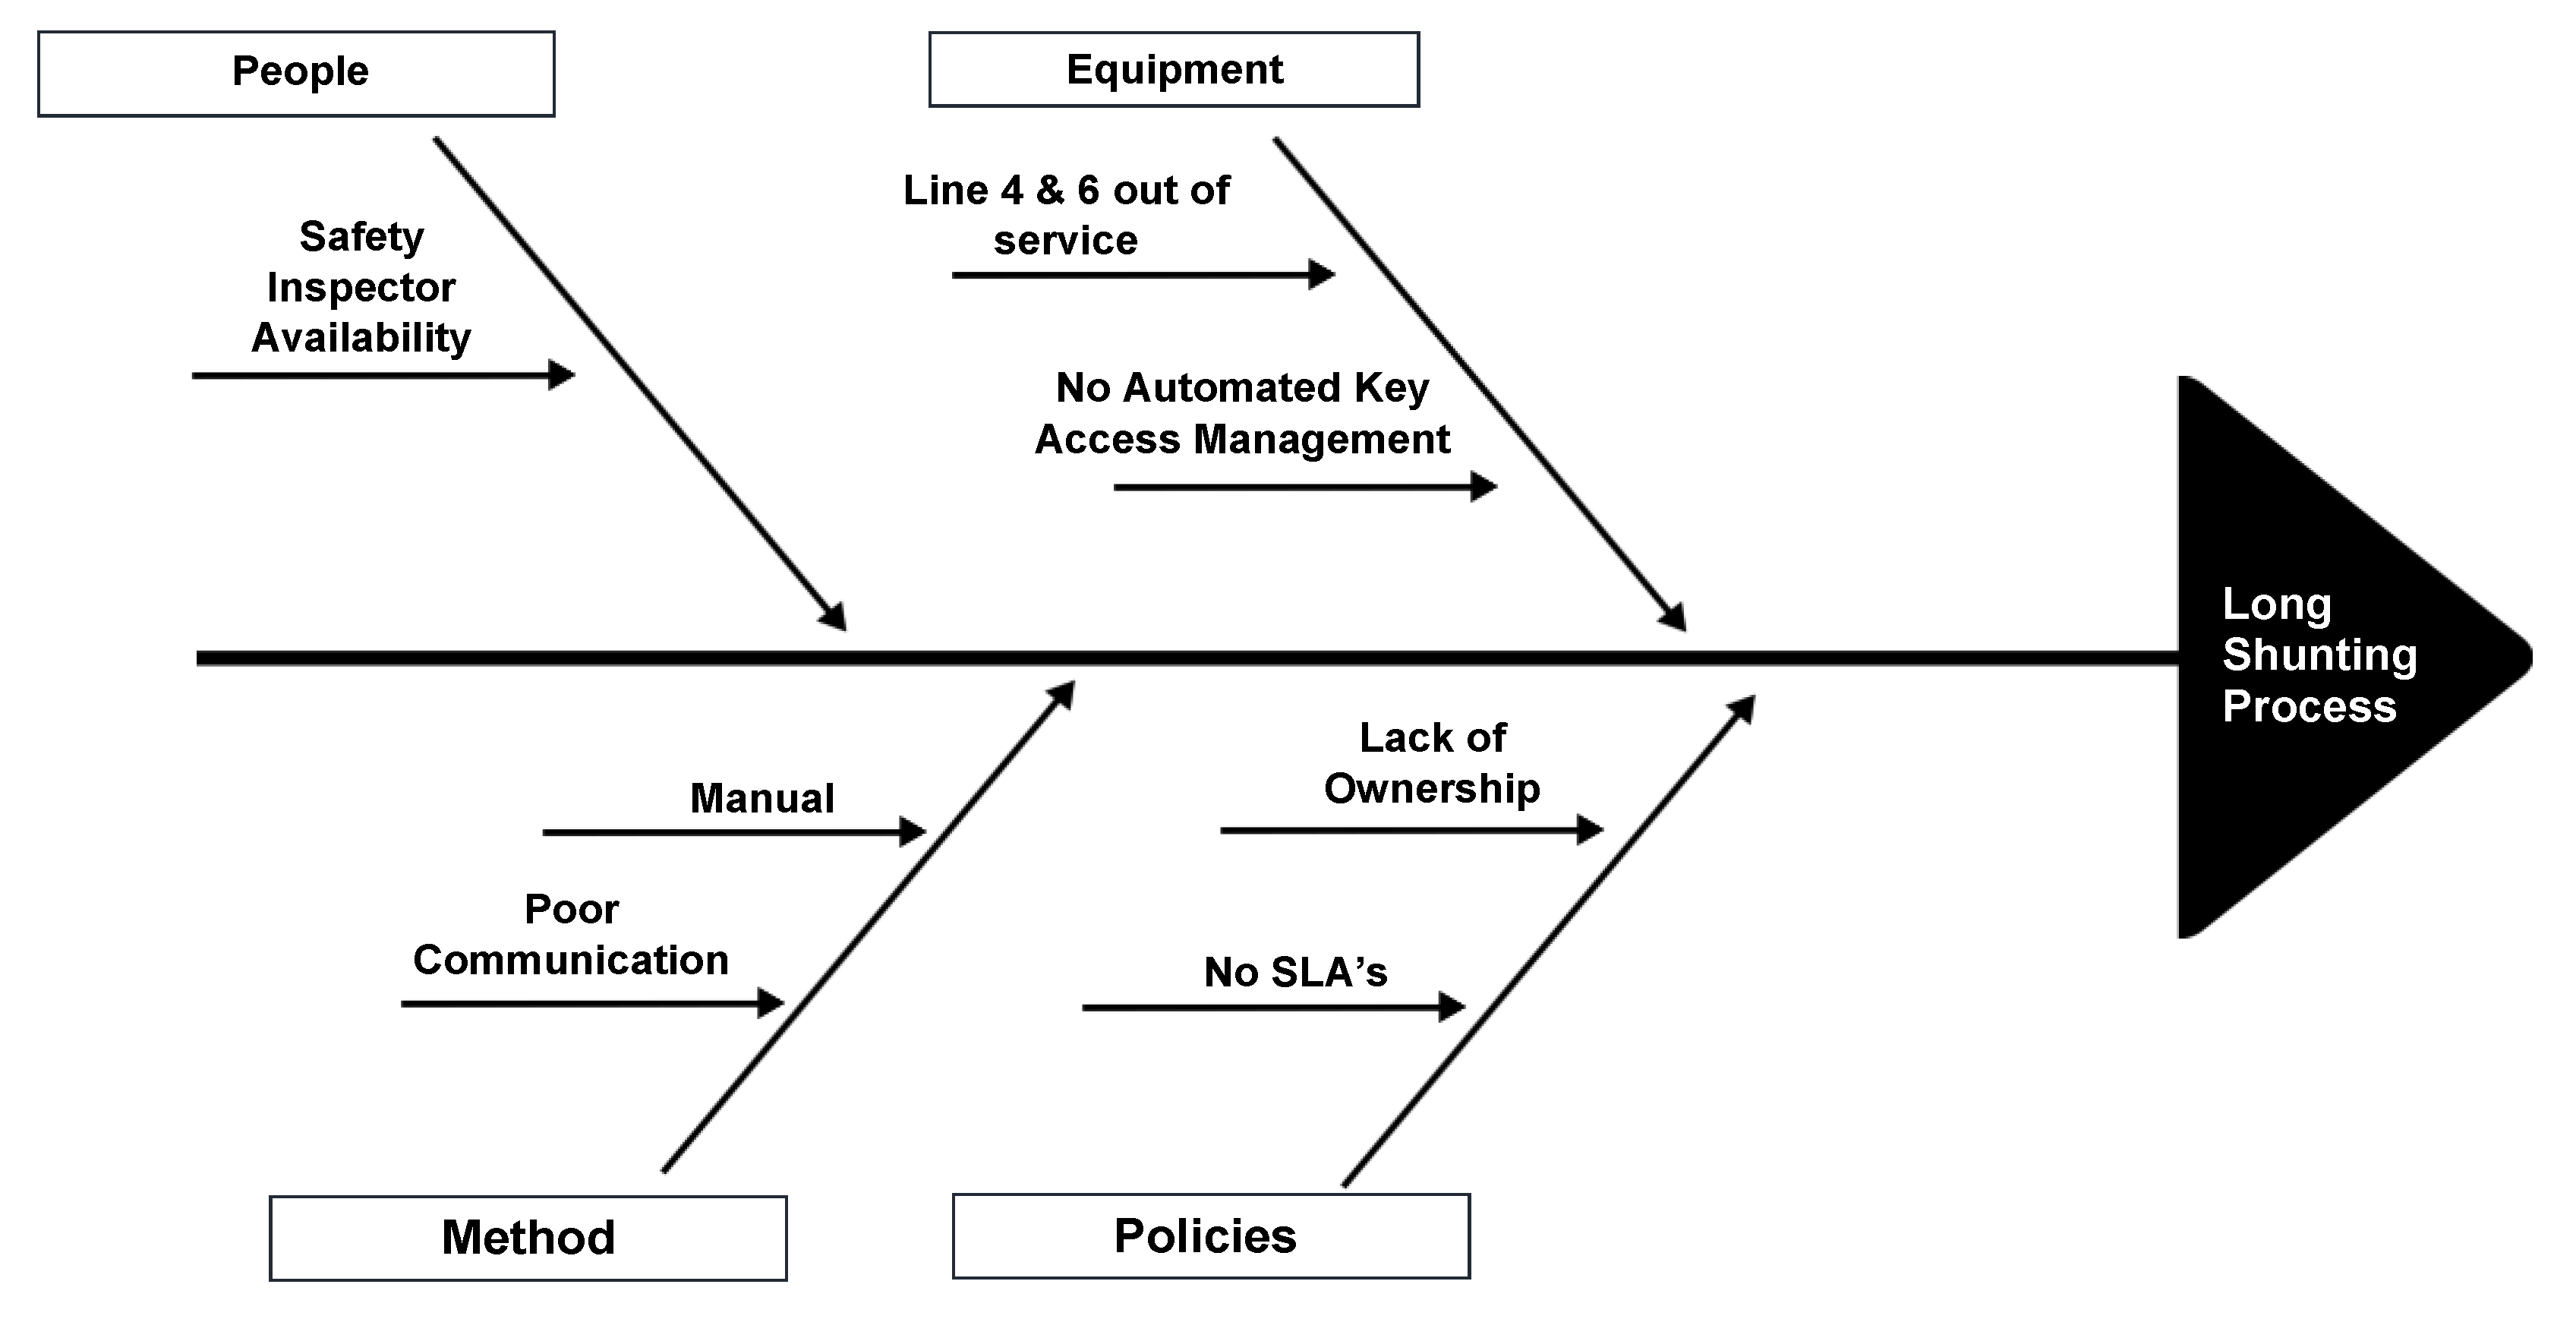
In order to analyze the main issues with the shunting process, brainstorming sessions were conducted. At first, an individual session with each stakeholder was completed in order to give each one the freedom to point out any flaws within the process. Then, the next step was to hold a group brainstorming session with all stakeholders. In that session, a cause-and-effect (Fishbone) diagram was used, as shown in Figure 10, and the focus was on the following areas: policies, method, equipment, and people. The discussion of these four areas is presented in Section 4. Previously, in the measure phase, quantitative techniques were used to measure the magnitude of how problematic the shunting process is. The fishbone diagram allows for a qualitative analysis to identify the root causes of extremely long shunting process times. The identification of such causes provides an opportunity for improving the process as well as improving the entire system by means of benchmarking.
4. Discussion
In this section, a detailed discussion of the analysis phase is presented.
- Policies: In policies, two main issues were identified. The main issues identified were that there is no service level agreement (SLA) and there is a lack of ownership between the stakeholders. The policies in the company should mandate SLAs as there are transactions between two departments in several areas (delivering the train from operations to RSM, for example).
- Method: In method, there is no manual that standardizes the methodology of shunting the trains. Therefore, the process is changing, depending on the personnel who are performing the shunting activity. Additionally, the communication can be enhanced and standardized.
- Equipment: The shunting time depends heavily on the availability of the lines inside the workshop as it can be used for parking. In 2020, RSM reported that lines 4 and 6 can no longer be used and that they are out of service for safety reasons (the lines cannot hold the load), which resulted in a 33% loss of capacity. RSM requested that the Facility Department repair the lines as soon as possible, but no progress was observed. Another issue is that the parking of trains is fully manual and requires the attendance of safety inspectors. This is a result of the absence of an automated key access management, which can automate the entire parking process and make it safer.
- People: Since the parking of the train process is not automated, the availability of a safety inspector is required with each parking. Without a safety inspector, this process cannot be carried out. Depending heavily on a human resource contains a high risk since human errors are common.
5. Conclusions
The Fishbone analysis enabled the determination of the root causes of the unacceptable delays in the shunting process. In fact, it is predicted that if these root causes are fixed, the shunting process time will not take more than 15 min, which is half of the best records the company achieved back in 2019.
It is recommended in the “Improve” phase that the planning team prioritizes the issues based on the cost vs. value analysis to ensure better optimization of company’s resources. Once the shunting process is fixed, the RSM planning team has an opportunity to tackle the next process in the Pareto analysis which is an “Operational Check Process” and investigate the 93% increased processing time.
One important aspect of process improvement is that these improvements need to be sustained and controlled, which is the fifth and final phase of DMAIC cycle, “Control”. Using DMAIC helped in managing the improvement process effectively and in determining the root causes of issues associated with delays. The DMAIC cycle showed that it is a tool that can be used in any industry, helping companies to improve and grow. The contributions of this paper are highlighted as follows:
- The shunting bottleneck process is identified and measured in the studied railway operation through numerical and statistical methods.
- The shunting process is further analyzed through cause and effect to produce an actionable plan for process improvement and sustainable train operations.
These contributions highlight the next steps for future research in regard to the studied railway system. For example, carrying out the suggested improvements and examining the effect on the shunting process is crucial. Another potential future research opportunity is utilizing the availability of more collected data to obtain a more accurate prediction of processing times.
Author Contributions
Conceptualization, A.A. (Abdelhakim Abdelhadi); Formal analysis, M.A., A.A. (Aos Alzahrani) and M.B.; Investigation, M.A., A.A. (Aos Alzahrani) and M.B.; Methodology, M.A., A.A. (Aos Alzahrani), M.B. and K.A.; Software, K.A.; Validation, K.A. and R.A.; Writing—original draft, M.A., A.A. (Aos Alzahrani) and M.B.; Writing—review and editing, K.A. and R.A. All authors have read and agreed to the published version of the manuscript.
Funding
This research was funded by Prince Sultan University (PSU), Riyadh, Saudi Arabia.
Institutional Review Board Statement
Not applicable.
Informed Consent Statement
Not applicable.
Data Availability Statement
The data is available in Table 2.
Acknowledgments
The authors gratefully acknowledge the support provided by the Master of Engineering Management Program at Prince Sultan University (PSU).
Conflicts of Interest
The authors have declared no conflict of interest.
References
- Bergman, Z.; Bergman, M.M. A Case Study of the Sustainable Mobility Problem–Solution Paradox: Motility and Access of Metrorail Commuters in the Western Cape. Sustainability 2019, 11, 2842. [Google Scholar] [CrossRef] [Green Version]
- Sujova, A.; Simanova, L.; Marcinekova, K. Sustainable Process Performance by Application of Six Sigma Concepts: The Research Study of Two Industrial Cases. Sustainability 2016, 8, 260. [Google Scholar] [CrossRef] [Green Version]
- Sokovic, M.; Pavletic, D.; Kern Pipan, K. Quality Improvement Methodologies -PDCA Cycle, RADAR Matrix, DMAIC and DFSS. J. Achiev. Mater. Manuf. Eng. 2010, 43, 476–483. Available online: http://jamme.acmsse.h2.pl/papers_vol43_1/43155.pdf (accessed on 1 December 2021).
- Harrington, H.J. The new model for improvement: Total improvement management. Bus. Process Re-Eng. Manag. J. 1995, 1, 31–43. [Google Scholar] [CrossRef]
- Mitra, A. Fundamentals of Quality Control and Improvement; John Wiley & Sons: Hoboken, NJ, USA, 2016. [Google Scholar]
- Rozak, A.; Jaqin, C.; Hasbullah, H. Increasing overall equipment effectiveness in automotive company using DMAIC and FMEA method. J. Eur. Syst. Autom. 2020, 53, 55–60. [Google Scholar] [CrossRef] [Green Version]
- Smętkowska, M.; Mrugalska, B. Using Six Sigma DMAIC to Improve the Quality of the Production Process: A Case Study. Procedia Soc. Behav. Sci. 2018, 238, 590–596. [Google Scholar] [CrossRef]
- Vijay, S.A. Reducing and optimizing the cycle time of patients discharge process in a hospital using six sigma dmaic approach. Int. J. Qual. Res. 2014, 8, 169–182. Available online: http://www.ijqr.net/journal/v8-n2/3.pdf (accessed on 1 December 2021).
- Qureshi, M.I.; Janjua, S.Y.; Zaman, K.; Lodhi, M.S.; Tariq, Y.B. Internationalization of higher education institutions: Implementation of DMAIC cycle. Scientometrics 2014, 98, 2295–2310. [Google Scholar] [CrossRef]
- Karakhan, A. Six sigma & construction safety: Using the DMAIC cycle to improve incident investigations. Prof. Saf. 2017, 62, 38. [Google Scholar]
- Hamza, S.E.A. Design process improvement through the DMAIC Six Sigma approach: A case study from the Middle East. Int. J. Six Sigma Compet. Adv. 2008, 4, 35–47. [Google Scholar] [CrossRef]
- Kaushik, P.; Khanduja, D. Application of Six Sigma DMAIC methodology in thermal power plants: A case study. Total Qual. Manag. 2009, 20, 197–207. [Google Scholar] [CrossRef]
- Kim, Y.W.; Han, S.H. Implementing Lean Six Sigma: A case study in concrete panel production. In Proceedings of the 20th Annual Conference of the International Group for Lean Construction, San Diego, CA, USA, 18–20 July 2012. [Google Scholar]
- Improta, G.; Balato, G.; Romano, M.; Ponsiglione, A.M.; Raiola, E.; Russo, M.A.; Cuccaro, P.; Santillo, L.C.; Cesarelli, M. Improving performances of the knee replacement surgery process by applying DMAIC principles. J. Eval. Clin. Pract. 2017, 23, 1401–1407. [Google Scholar] [CrossRef]
- Zarbo, R.J. Creating and sustaining a lean culture of continuous process improvement. Am. J. Clin. Pathol. 2012, 138, 321–326. [Google Scholar] [CrossRef] [Green Version]
- Ohno, T.; Bodek, N. Toyota Production System: Beyond Large-Scale Production; Productivity Press: New York, NY, USA,, 2019. [Google Scholar]
- Womack, J.P.; Jones, D.T.; Roos, D. The Machine That Changed the World: The Story of Lean Production—Toyota’s Secret Weapon in the Global Car Wars That Is Now Revolutionizing World Industry; Simon and Schuster: New York, NY, USA, 2007. [Google Scholar]
- Pedregosa, F.; Varoquaux, G.; Gramfort, A.; Michel, V.; Thirion, B.; Grisel, O.; Blondel, M.; Prettenhofer, P.; Weiss, R.; Dubourg, V.; et al. Scikit-learn: Machine Learning in Python. J. Mach. Learn. Res. 2011, 12, 2825–2830. [Google Scholar]
- Tseng, M.-L.; Bui, T.-D.; Lim, M.K.; Lewi, S. A Cause and Effect Model for Digital Sustainable Supply Chain Competitiveness under Uncertainties: Enhancing Digital Platform. Sustainability 2021, 13, 10150. [Google Scholar] [CrossRef]
- Koch, N.; Niewiadomski, A.P.; Wrona, P. Influence of Light Wavelengths on Visibility in Smoke during a Tunnel Fire. Sustainability 2021, 13, 11599. [Google Scholar] [CrossRef]
- Negash, Y.T.; Hassan, A.M.; Batbaatar, B.; Lin, P.-K. Household Waste Separation Intentions in Mongolia: Persuasive Communication Leads to Perceived Convenience and Behavioral Control. Sustainability 2021, 13, 11346. [Google Scholar] [CrossRef]
- Melese, K.B.; Belda, T.H. Determinants of Tourism Product Development in Southeast Ethiopia: Marketing Perspectives. Sustainability 2021, 13, 13263. [Google Scholar] [CrossRef]
- Kazmi, S.H.A.; Ahmed, R.R.; Soomro, K.A.; Hashem E, A.R.; Akhtar, H.; Parmar, V. Role of Augmented Reality in Changing Consumer Behavior and Decision Making: Case of Pakistan. Sustainability 2021, 13, 14064. [Google Scholar] [CrossRef]
- Boulouta, I.; Manika, D. Cause-Related Marketing and Ethnocentrism: The Moderating Effects of Geographic Scope and Perceived Economic Threat. Sustainability 2022, 14, 292. [Google Scholar] [CrossRef]
- Kim, J.; Han, J.-G.; Kang, G.; Chin, K.-H. Framework of Prediction Model for Mid- to Long-Term Performance Changes of Urban Railway Facilities Based on Performance Evaluation Reports. Sustainability 2021, 13, 13397. [Google Scholar] [CrossRef]
- Kowalski, J.; Połoński, M.; Lendo-Siwicka, M.; Trach, R.; Wrzesiński, G. Method of Assessing the Risk of Implementing Railway Investments in Terms of the Cost of Their Implementation. Sustainability 2021, 13, 13085. [Google Scholar] [CrossRef]
- Zhou, W.; Oldache, M. Integrated Optimization of Line Planning, Timetabling and Rolling Stock Allocation for Urban Railway Lines. Sustainability 2021, 13, 13059. [Google Scholar] [CrossRef]
- Larumbe, J. Evaluating Sustainability of Mass Rapid Transit Stations in Dubai. Sustainability 2021, 13, 12965. [Google Scholar] [CrossRef]
- Jurković, Ž.; Hadzima-Nyarko, M.; Lovoković, D. Railway Corridors in Croatian Cities as Factors of Sustainable Spatial and Cultural Development. Sustainability 2021, 13, 6928. [Google Scholar] [CrossRef]
Figure 1.
DMAIC cycle methodology as applied to the studied railway system.

Figure 2.
Process flow of railway services.

Figure 3.
NSR Fleet availability of the railway understudy.

Figure 4.
Average time per process in years.

Figure 5.
Pareto analysis of the railway processes.

Figure 6.
Processing times trend of the railway processes.

Figure 7.
Processing times prediction of the shunting process.

Figure 8.
Two-step-ahead predictions of the shunting process times.

Figure 9.
Error rates relative to number-of-steps-ahead prediction of the shunting process.

Figure 10.
Fishbone diagram of the shunting process.


Table 1.
Processes details and owners.
| Process | Description | Owner |
|---|---|---|
| P01: Arrival of train to Passenger Station | Starting Process. No processing time measured. | Passenger Operations |
| P02: Unloading of Passengers | Passengers unloading from the train to the station. | Passenger Station |
| P03: Operational Check | Operations check for the whole train before handing the train back to RSM | Passenger Operations |
| P04: Unit Return Certificate (URC) | The process of officially handing over the train from Operations to RSM. | RSM |
| P05: Move Authorization | The authorization needed to move the train from Station to Workshop. | Operation Control Center (OCC) |
| P06: Shunting Process | For the train to go back to the workshop, the train needs to be shunted from the passenger line to one of the maintenance lines. | Passenger Operations Dependencies: RSM |
| P07: Train Stabilization | End Process. Train stabilized at the workshop. No processing time measured | Passenger Operations Dependencies: RSM |
Table 2.
Processing time in minutes/process (raw data).
| Process Time (In Minutes)/Month | P2 | P3 | P4 | P5 | P6 |
|---|---|---|---|---|---|
| Passenger Unloading | Operational Check | Unit Return Certificate | Move Authorization | Shunting Process | |
| Jun-18 | 13 | 20 | 11 | 19 | 35 |
| Jul-18 | 13 | 24 | 10 | 21 | 40 |
| Aug-18 | 15 | 22 | 12 | 22 | 48 |
| Sep-18 | 11 | 24 | 13 | 18 | 42 |
| Oct-18 | 12 | 22 | 11 | 18 | 40 |
| Nov-18 | 12 | 21 | 12 | 13 | 39 |
| Dec-18 | 15 | 19 | 9 | 16 | 33 |
| Jan-19 | 15 | 18 | 12 | 13 | 28 |
| Feb-19 | 15 | 21 | 9 | 14 | 35 |
| Mar-19 | 14 | 18 | 11 | 14 | 27 |
| Apr-19 | 14 | 18 | 8 | 14 | 33 |
| May-19 | 15 | 22 | 11 | 13 | 35 |
| Jun-19 | 15 | 19 | 12 | 17 | 27 |
| Jul-19 | 16 | 20 | 11 | 16 | 25 |
| Aug-19 | 14 | 19 | 10 | 17 | 32 |
| Sep-19 | 15 | 21 | 10 | 13 | 26 |
| Oct-19 | 16 | 18 | 8 | 13 | 33 |
| Nov-19 | 16 | 22 | 8 | 16 | 32 |
| Dec-19 | 14 | 22 | 9 | 13 | 27 |
| Jan-20 | 16 | 22 | 8 | 14 | 27 |
| Feb-20 | 14 | 19 | 12 | 15 | 31 |
| Mar-20 | 14 | 22 | 11 | 13 | 25 |
| Apr-20 | Operation Shutdown—(COVID-19) | ||||
| May-20 | |||||
| Jun-20 | 18 | 44 | 11 | 13 | 47 |
| Jul-20 | 18 | 45 | 8 | 17 | 49 |
| Aug-20 | 19 | 43 | 9 | 15 | 55 |
| Sep-20 | 19 | 48 | 12 | 14 | 64 |
| Oct-20 | 18 | 42 | 12 | 16 | 53 |
| Nov-20 | 17 | 46 | 12 | 16 | 45 |
| Dec-20 | 17 | 44 | 12 | 17 | 57 |
| Jan-21 | 18 | 39 | 8 | 13 | 70 |
| Feb-21 | 18 | 39 | 10 | 14 | 66 |
| Mar-21 | 18 | 40 | 8 | 13 | 67 |
| Apr-21 | 18 | 35 | 9 | 15 | 70 |
| May-21 | 19 | 42 | 9 | 15 | 73 |
| Jun-21 | 19 | 32 | 10 | 16 | 77 |
| Jul-21 | 19 | 41 | 11 | 13 | 66 |
| Aug-21 | 19 | 36 | 10 | 15 | 70 |
| Sep-21 | 18 | 42 | 11 | 14 | 73 |
| 2018 Avg. | 13 | 22 | 11 | 18 | 40 |
| 2019 Avg. | 15 | 20 | 10 | 14 | 30 |
| 2020 Avg. | 17 | 38 | 11 | 15 | 45 |
| 2021 Avg. | 18 | 38 | 10 | 14 | 70 |
Table 3.
RMSE and MAPE comparison of shunting time prediction.
| Steps Ahead Prediction | RMSE | MAPE (%) |
|---|---|---|
| 1 | 1.80 | 2.36 |
| 2 | 2.90 | 3.64 |
| 3 | 13.00 | 19.41 |
| 4 | 20.68 | 30.57 |
| 5 | 37.85 | 55.53 |
Publisher’s Note: MDPI stays neutral with regard to jurisdictional claims in published maps and institutional affiliations. |
© 2022 by the authors. Licensee MDPI, Basel, Switzerland. This article is an open access article distributed under the terms and conditions of the Creative Commons Attribution (CC BY) license (https://creativecommons.org/licenses/by/4.0/).
Share and Cite
MDPI and ACS Style
Alshamlan, M.; Alzahrani, A.; BinYousef, M.; Abdelhadi, A.; Akkad, K.; Alyamani, R. Optimization for Sustainable Train Shunting Services Using DMAIC Cycle. Sustainability 2022, 14, 1719. https://doi.org/10.3390/su14031719
AMA Style
Alshamlan M, Alzahrani A, BinYousef M, Abdelhadi A, Akkad K, Alyamani R. Optimization for Sustainable Train Shunting Services Using DMAIC Cycle. Sustainability. 2022; 14(3):1719. https://doi.org/10.3390/su14031719
Chicago/Turabian StyleAlshamlan, Mohammed, Aos Alzahrani, Musaad BinYousef, Abdelhakim Abdelhadi, Khaled Akkad, and Rakan Alyamani. 2022. "Optimization for Sustainable Train Shunting Services Using DMAIC Cycle" Sustainability 14, no. 3: 1719. https://doi.org/10.3390/su14031719
Note that from the first issue of 2016, this journal uses article numbers instead of page numbers. See further details here.