
How to Train Novices in Bayesian Reasoning
by
 ,
,
Theresa Büchter
1, 
Andreas Eichler
1,*,
Nicole Steib
2,
Karin Binder
3,
Katharina Böcherer-Linder
4,
Stefan Krauss
2 and
Markus Vogel
5 1
Institute of Mathematics, University of Kassel, 34132 Kassel, Germany
2
Faculty of Mathematics, University of Regensburg, 93053 Regensburg, Germany
3
Institute of Mathematics, Ludwig-Maximilians-University Munich, 80333 München, Germany
4
Department of Mathematics Education, University of Freiburg, 79104 Freiburg, Germany
5
Institute of Mathematics, University of Education Heidelberg, 69120 Heidelberg, Germany
*
Author to whom correspondence should be addressed.
Mathematics 2022, 10(9), 1558; https://doi.org/10.3390/math10091558
Submission received: 15 March 2022
/
Revised: 22 April 2022
/
Accepted: 28 April 2022
/
Published: 5 May 2022
(This article belongs to the Special Issue Statistics Education: An Immediate Need in a Changing World)
Abstract
:Bayesian Reasoning is both a fundamental idea of probability and a key model in applied sciences for evaluating situations of uncertainty. Bayesian Reasoning may be defined as the dealing with, and understanding of, Bayesian situations. This includes various aspects such as calculating a conditional probability (performance), assessing the effects of changes to the parameters of a formula on the result (covariation) and adequately interpreting and explaining the results of a formula (communication). Bayesian Reasoning is crucial in several non-mathematical disciplines such as medicine and law. However, even experts from these domains struggle to reason in a Bayesian manner. Therefore, it is desirable to develop a training course for this specific audience regarding the different aspects of Bayesian Reasoning. In this paper, we present an evidence-based development of such training courses by considering relevant prior research on successful strategies for Bayesian Reasoning (e.g., natural frequencies and adequate visualizations) and on the 4C/ID model as a promising instructional approach. The results of a formative evaluation are described, which show that students from the target audience (i.e., medicine or law) increased their Bayesian Reasoning skills and found taking part in the training courses to be relevant and fruitful for their professional expertise.
Keywords:
Bayesian Reasoning; Bayes’ rule; visualization; unit square; double tree; natural frequencies; 4C/ID modelMSC:
97U10; 97U50; 97U80; 97C30; 97C701. Introduction
Bayes’ rule is a small part of elementary probability theory. Nevertheless, it has become a fundamental idea in probability [1] and the basis of several statistical domains such as data mining or Bayesian statistics [2]. One reason for the importance of Bayes’ rule is that it allows an update to probability on the basis of new evidence for decision making [3]. This decision making in so-called Bayesian situations (i.e., situations in which Bayes’ rule can be applied) is decisive in various non-mathematical disciplines such as medicine [4], law [5] and economics [6]. However, research in psychology found consistently, over several decades, that people struggle greatly when dealing with Bayesian situations [7,8,9]. Cosmides and Tooby [10] stated that applying Bayes’ rule produces “clashes between intuition and probability”. Unfortunately, professionals are faced with the same obstacles as laymen when dealing with Bayes’ formula. For example, Eddy [11] found that only 5% of physicians were able to appropriately interpret a Bayesian situation such as updating a hypothesis on a patient’s state of health in the light of a new medical test result. Further examples involving physicians are documented by Gigerenzer [12]. As a result, wrong diagnoses and wrong conclusions are well known, for example, in medicine as well as law, both resulting in possible tragic results such as destroyed life quality or even suicide [13,14].
One typical Bayesian situation concerning an unspecified disease, in which statistical information could be used to revise an a priori probability to an a posteriori probability, was described by Johnson and Tubau [15]:
“10% of women at age forty who participate in a study have a particular disease. 60% of women with the disease will have a positive reaction to a test. 20% of women without the disease will also test positive. Calculate the probability of having the particular disease if given a positive test result.”
Bayesian situations that represent a situation in law have the same structure:
In 10% of comparable cases regarding a specific criminal offense, the charges are actually correct. In 60% of the cases in which the charges are correct, incriminating evidence is given. In 20% of the cases in which the charges are incorrect, incriminating evidence is given nevertheless.
In both of these scenarios, a structure of the Bayesian situations with two outcomes of a hypothesis (e.g., with or without the disease) and two outcomes of some information (e.g., a positive or negative test result) becomes evident. Not every research cited in this paper formulated the statistical information in Bayesian situations as probabilities (as in the examples above), but also frequencies and proportions. Research in psychology and mathematics education mostly studied Bayesian situations with said 2 (hypothesis) × 2 (information) structure (for exceptions, see [16,17]) and, fortunately, found strategies that facilitate Bayesian Reasoning; we define this as people’s dealing with, and understanding of, such Bayesian situations. Brase [18] summarized these strategies as “use frequencies […] and use pictures”, with “pictures” referring to visualizations of Bayesian situations. Indeed, there exists a large body of research that reports the facilitating effect of (natural) frequencies and visualizations on people’s performance when dealing with Bayesian situations [9]. In the related studies, performance usually means using Bayes’ formula to calculate the probability of the hypothesis H given the statistical information I—i.e., —(for exceptions see e.g., [19]) on the basis of three given probabilities: the so-called base rate , the true-positive rate and the false-positive rate . Applying the probabilities from the above-mentioned unspecified medical condition and legal situations within Bayes’ formula results in the following:
Thus, in the given context, there is about a 25% probability that the woman actually has the disease, given a positive test result, or that the legal charges are actually correct, given incriminating evidence. In the large body of research on Bayesian Reasoning, two desiderata can be identified: firstly, to investigate people’s abilities to deal with Bayesian situations beyond the aspect of Bayesian Reasoning, which we call performance (see Section 2.1) and, secondly, to investigate people’s abilities to deal with Bayesian situations after training concerning this matter [20].
In this paper, we contribute to both desiderata by presenting a training course for Bayesian Reasoning that addresses professions in which Bayesian Reasoning is crucial, namely medicine and law. The aim of the presented training courses is to teach novice learners how to use Bayesian Reasoning in the field of medicine and law. Moreover, the training courses are designed to also be appropriate for teaching this topic in schools. As a consequence, we focus on Bayesian situations with a 2 (hypothesis) × 2 (information) structure and adequate teaching methods for these situations. For mathematically skilled and experienced students who also need to learn about situations with a more general n⨯m structure, different teaching approaches from the ones we present here might be more appropriate (example studies conducted by the authors are [16,17]). The claim for our training is that it is evidence-based and makes use of existing research results in psychology and mathematics education. Furthermore, our training refers (besides performance in Bayesian situations) to the ability to understand the covariation of parameters as a crucial part of Bayesian Reasoning. We organize this paper by, firstly, elaborating upon the construct of Bayesian Reasoning. To do so, we discuss the categories of Bayesian Reasoning, we explain the facilitating strategies—natural frequencies and visualization—and we report existing approaches to training in Bayesian Reasoning. Afterwards, we discuss the development of our training on the basis of the 4C/ID approach [21]. Finally, we report a formative evaluation of this training, which was the basis for adjustments to the training.
2. Evidence-Based and Theoretical Considerations for Developing a Training Course on Bayesian Reasoning
2.1. Categories of Bayesian Reasoning
Zhu and Gigerenzer [22] described Bayesian Reasoning as reasoning in a situation, in which a binary hypothesis (e.g., disease and no disease ) and a binary set of information (e.g., test positive and test negative ) are given. As mentioned above, we also refer in this paper to Bayesian situations in a 2 (binary hypothesis) × 2 (binary information) case, which are ecologically valid in the domains of both law and medicine, and are specifically suitable for novice learners (the target group of the training courses presented). In these situations, Bayes’ rule can be applied to compute the so-called positive predictive value . As mentioned above, the ability to compute a conditional probability with the formula above, such as the positive predictive value, is called performance in research concerning Bayesian Reasoning. In this paper, in contrast to previous papers, we define performance as just one part of Bayesian Reasoning.
However, it is sometimes mentioned that performance might be only one part of Bayesian Reasoning and should not be equated with an in-depth understanding of Bayesian situations [23]. For example, the ability to appropriately estimate the effect of changing variables such as , or on the positive predictive value is an ability that goes beyond performance [24]. The functional relationship between independent variables and a dependent variable is called covariation [25]. The term ‘covariation’ is also partly used to describe the ability to deal with a functional covariation [26], along with the term ‘covariational reasoning’ [27]. In this paper, we use the term covariation to describe people’s ability to deal with functional covariation, and we define covariation as part of Bayesian Reasoning that is (compared to performance) a higher-order ability of Bayesian Reasoning.
Finally, the ability to interpret and communicate mathematical results (such as the positive predictive value) is understood as part of mathematical competencies [28] and as a crucial part of statistical and probabilistic thinking in particular [29,30]. Thus, we also define interpretation of the positive predictive value and the ability to communicate its meaning in a concrete Bayesian situation as a further elaborated part of Bayesian Reasoning, and call this part communication. This part of Bayesian Reasoning represents the ability to connect the purely mathematical elements (performance and covariation) with the context in which Bayesian Reasoning is applied. The need for accurate statistical communication obviously overlaps with specific communication demands in the profession. For instance, some of the communication skills necessary in the professional field of medicine (e.g., to inform patients while displaying some empathy, avoiding technical language, etc.) [31] are in contrast to some of the communication demands from the field of law (e.g., to persuade the jury) [32]. However, certain aspects can be identified for expert-laypeople communication in general, such as the necessity for experts to consider the layperson’s perspective in order to establish common ground [33]. Therefore, we include communication as a part of Bayesian Reasoning, to refer to the ability to correctly and adequately express the probabilistic information in an expert-layman setting.
To conclude, Bayesian Reasoning occurs in complex professional tasks that require the integration of knowledge and skills with performance, covariation and communication. Due to these diverse aspects of Bayesian Reasoning, we underline its character as a complex cognitive skill which necessitates complex learning [34].
2.2. Facilitating Bayesian Reasoning through Natural Frequencies
There is a wide consensus in research that natural frequencies facilitate Bayesian Reasoning [15]. Natural frequencies were introduced by Gigerenzer and Hoffrage [8] and include a pair of natural numbers [35] that represent, for instance, an expected frequency for an event on the basis of a fictitious sample. The medical Bayesian situation stated above could be formulated with natural frequencies as follows [15]:
“10 out of 100 women at age forty who participate in a study have a particular disease. 6 out of 10 women with the disease will have a positive reaction to a test. 18 out of 90 women without the disease will also test positive. Calculate the proportion of women who may have the particular disease, given a positive test result.”
In addition to the use of natural frequencies, in this representation of a Bayesian situation, so-called natural sampling [36] is used, whereby the statistical information is transferred to an imaginary sample of people. Thus, the expected number of women with the disease in the imaginary sample is used as the sample for the natural frequency of testing positive for the disease.
The meta-analysis of McDowell and Jacobs [9] state that the percentage of people who were able to deal with Bayesian situations increased from about 5% (statistical information given with probabilities or percentages) to about 25% (statistical information given as natural frequencies). This increase seems to be robust for different groups of participants and across different Bayesian situations.
2.3. Facilitating Bayesian Reasoning through Visualization
A second strategy that seems to facilitate Bayesian Reasoning is the visualization of statistical information [37]. Although the results referring to this strategy are more ambiguous than those referring to the facilitating effect of natural frequencies, the potential of visualizations to boost Bayesian Reasoning seems to be confirmed [38]. However, the specific characteristics of the visualization used to represent a Bayesian situation seems to be relevant for the facilitating effect [39]. One characteristic concerns the use of natural frequencies for displaying the statistical information in a Bayesian situation (Figure 1) [19,40]. Another significant requirement seems to be emphasis on the nested-set structure of a Bayesian situation [24,39,41,42]. Figure 1 shows three different styles of visualizations of Bayesian situations, i.e., (from left to right), a branch style (double tree diagram), a nested style (unit square) and a frequency style (icon array) [43]. These three visualizations make the nested-sets structure of a Bayesian situation transparent by showing both parts of the natural frequencies given in a Bayesian situation [39,41]. In addition, the unit square also includes a geometrical representation of the probabilities in a Bayesian situation, given by the length of line segments or areas. Finally, the icon array includes icons as statistical entities, which could produce a further facilitating effect [18,39].
The double tree and unit square also exist in probability-based versions; however, in the frequency version shown here, Böcherer-Linder and Eichler [39] found that all three visualizations increased people’s performance in Bayesian situations to about 70% compared with the average of 5% (statistical information is given with probabilities in a textual form only) and 25% (statistical information is given in a textual form with natural frequencies, but without visualization) highlighted in the meta-analysis [9]. This study also highlighted that performance was better with double trees and unit squares than with regular tree diagrams which are often used for teaching probability in schools and universities [39]. Therefore, the structure of the Bayesian situation seems to be more intuitive in double trees and unit squares than in tree diagrams. Moreover, while performance based on icon arrays is even slightly higher than in double trees and unit squares [39], pedagogical considerations about a concrete learning situation argue against their use in a training course, as it is very time-consuming to draw them. Additionally, although 2 × 2 tables have some merits [39], they are primarily supportive if frequencies (instead of probabilities) are used; on top of that, the given parameters of the Bayesian situation (e.g., true- and false-positive rate) cannot be displayed. Taken together, the comparison of different visualizations yielded both evidence-based and practical advantages of the double tree and the unit square over other visualizations [39]. As a consequence, we argue that the double tree and the unit square with frequencies are the most promising representations of a Bayesian situation for our training courses. As no significant differences in performance between the two visualizations have yet been identified [39], we expect both versions to be equally helpful and, therefore, we design and describe one training course with the double tree, and one training course with the unit square.
2.4. Training Bayesian Reasoning
As well as natural frequencies (Section 2.2) and visualizations (Section 2.3), a third facilitating strategy to improve Bayesian Reasoning is, of course, to develop specific training courses. Although this strategy might be self-explanatory from an educational perspective, the development of training courses and evaluation of the effect of these training courses is still an under-researched topic concerning Bayesian Reasoning [20]. In the following table, we briefly characterize existing training courses with regard to the sample, duration, information format of the statistical information, and the form of visualization used (Table 1).
We focus on describing the conceptual characteristics of existing training courses here, as the conceptualization of the training courses in our study is the focus of this paper. Although in each of the cited studies a positive effect on performance in Bayesian situations was documented, all of these training courses lack at least one of the following aspects:
- In some of the interventions, probabilities were used as an information format for statistical data [44]. However, research has consistently shown that using natural frequencies or translating probabilities into natural frequencies can boost people’s performance in Bayesian situations.
- In most of the interventions, a tree diagram was used to visualize the statistical information of Bayesian situations [46]. However, as mentioned above, although a tree diagram does increase people’s performance, research has also yielded evidence that other visualizations are more promising.
- Most of the participants who were recruited did not study a subject which specifically requires Bayesian Reasoning [20]. Exceptions occurred in the intervention studies that refer to medicine students who worked with medical Bayesian situations.
- None of the intervention studies refer to Bayesian Reasoning as a complex cognitive skill involving abilities beyond performance.
In our training courses, we refer to promising visualizations (specifically the double tree and the unit square) and use natural frequencies. We further developed our training courses for a specific audience, i.e., students of medicine and students of law. Finally, we include covariation as part of Bayesian Reasoning in our training course, and also address communication. Since we refer to Bayesian Reasoning as a complex cognitive skill, we use an elaborated approach for teaching interventions, specifically the 4C/ID model.
2.5. Four-Component Instructional Design (4C/ID) Model
The four-component instructional design (4C/ID) model is specifically tailored to complex learning processes and, therefore, is suitable for the teaching of Bayesian Reasoning. Moreover, empirical results show that the 4C/ID model is a very effective instructional method as it has been used for designing training programs within different domains, such as medicine [53] and problem solving [54], among others (e.g., [55,56]). A recent meta-analysis showed that developing educational programs with 4C/ID resulted in a positive impact on performance with a strong effect size [57]. These positive effects were moderated by the students’ educational level, with higher positive effects for students in higher education (e.g., in college or university). As we develop the training programs for university students, the 4C/ID model as an instructional method seems particularly promising. In this Section 2.5, we explain the components of the model in general, whereas in Section 3, we explain how we have concretely achieved these components in our training courses on Bayesian Reasoning.
Four interconnected components are central to successful complex learning, according to the 4C/ID model [21]: (1) learning tasks, which are the backbone of the instructional blueprint and represent authentic real-life situations as learning opportunities; (2) supportive information, which is information on non-recurrent aspects of the tasks in the form of so-called mental models and cognitive strategies; (3) procedural information, which is particularly helpful for recurrent aspects during work on the learning tasks; and (4) part-task practice (i.e., repeated work on isolated, crucial parts of the task), which is only desirable to gain very high repetitive routine skill in the learning tasks (and, therefore, is not implemented in our training course). The 4C/ID model stands out for its assumption that different skill sets should not be learned in isolation, but should be integrated into the learning process, as real-life tasks also require the use of different skills in a coordinated and integrated fashion [58].
2.5.1. Learning Tasks
The 4C/ID model is a task-centered approach, with learning tasks which represent authentic real-life situations at the heart of the instructional model [34]. Authentic tasks are relevant for learners, and help them to integrate the knowledge and skills instead of acquiring single skills in an isolated manner [21]. Thus, the tasks need to represent the full spectrum of skill sets in order to serve as a fruitful learning opportunity. Tasks should be sequenced from simple to complex [58]. As spelled out in Section 2.1, we have identified different aspects of Bayesian Reasoning (performance, covariation, communication), which vary in their complexity. Consequently, all of these aspects form their own task class with the aspect of performance being the most basic and, therefore, the starting point of the learning opportunity.
2.5.2. Supportive Information
Supportive information concerns two types of knowledge for the non-recurrent aspects of learning tasks. “First, it concerns the cognitive strategies that allow one to perform tasks and solve problems in a systematic fashion. (…) In addition to this, supportive information also concerns the mental models that allow one to reason within the task domain.” [21] (p. 249). Mental models “are cognitive artifacts or interventions of the human mind that can be considered to be the best-organized representations among declarative learning results” [59] (p. 62f). Thus, concerning Bayesian Reasoning, we understand a mental model to be the “best-organized” structure of a Bayesian situation. Cognitive strategies, on the other hand, refer to the strategic or procedural knowledge on how to approach problems and efficiently solve them [21]. One promising strategy for learning about a cognitive strategy is a worked example which, according to Clark, Nguyen, and Sweller [60], is “a step-by-step demonstration of how to perform a task or solve a problem” (p. 190). Studying worked examples is an effective instructional strategy to teach complex problem-solving skills [21], especially for the initial acquisition of cognitive skills [61]. Both aspects of supportive information (cognitive strategies and mental models) support the non-recurrent problem-solving and reasoning aspects of the learning tasks. As a consequence, the supportive information is specific to each task class (e.g., performance, covariation), while the procedural information addresses aspects of all task classes simultaneously [62].
2.5.3. Procedural Information
Procedural information aims to facilitate the recurrent aspects of the learning tasks, and is therefore non-specific to the task classes [21]. It is preferably presented at exactly the point in time in which the learners need it (so-called ‘just-in-time information’). Just-in-time information specifies “rules that allow one to carry out particular recurrent aspects of performance in an algorithmic fashion (…) [and] those things that the learner should know in order to be able to correctly apply those rules (i.e., prerequisite knowledge)” [21] (p. 349). It can be presented in information displays, as well as step-by-step instructions. Additionally, procedural information also includes corrective feedback on recurrent aspects.
2.5.4. Part-Task Practice
Finally, part-task practice can (but should not always) be included for the recurrent aspects in order to establish a highly precise routine and a high level of automaticity. These exercises train and drill the different aspects and should (if added to a training course) be used rarely, as the practice of only isolated parts means breaking up the whole learning tasks into pieces. As described by van Merriënboer and Kirschner [21] “Part-task practice is often pointless because the learning tasks themselves provide sufficient opportunity to practice both recurrent and non-recurrent aspects of a complex skill” (p. 431). It should only be used for aspects which need a very high level of automaticity, e.g., to measure blood pressure or carry out a cardiopulmonary resuscitation (CPR) for medical practitioners [34], or to practice scales on an instrument for musicians [58]. As a consequence, we regard part-task practice as non-necessary in our training courses for Bayesian Reasoning, as whole-task practice seems sufficient.
3. Description of the Training Course on Bayesian Reasoning
One central idea of the training courses is to use and optimize successful strategies, which have been identified in prior research on Bayesian Reasoning. As argued in Section 2, these successful strategies refer to:
- The format of statistical information: using natural frequencies;
- The visualization of statistical information: using a double tree or unit square; and
- The instructional approach: using the 4C/ID model.
In the presented training courses, we focus on the two predominantly mathematical aspects of Bayesian Reasoning: performance (see Section 3.2) and covariation (see Section 3.3). Developing material on the aspect of communication goes beyond our expertise as researchers in the field of mathematics education, and is therefore planned as part of future projects in cooperation with experts from medicine and law.
3.1. Learning Tasks: Performance, Covariation and Communication in Real-Life Bayesian Situations
In describing the instructional design process of the 4C/ID model, van Merriënboer and Kirschner [21] argue that real-life tasks “are best identified by interviewing both professionals working in the task domain and trainers with experience of teaching in that domain” (p. 103). Thus, we cooperated with experts from the domains of medicine and law in order to generate learning tasks that are authentic as regards the context and statistical data. Consequently, we interviewed doctors, researchers in medical education, lawyers, judges, attorneys and university teachers in the field of law. In doing so, we discussed in which contexts professionals from the fields of medicine and law are required to evaluate risks (based on given indicators) and, consequently, need to reason in a Bayesian manner. Consecutively, we designed initial drafts of such learning tasks, then discussed their authenticity and applicability with the experts.
Through this exchange of information with the experts, we developed seven different contexts for law and medicine which are all structured in a similar way and implemented digitally. This enables us to control the sequence of tasks, better support the tasks and easily administer the material to a large number of students. Moreover, while the physical fidelity in these digital tasks is low (e.g., medical students are not in an actual hospital with real patients), the psychological fidelity is high due to the authenticity of these contexts, and therefore, ideal for novice learners [21]. In the description of the learning environment, first, the context of the authentic situation is outlined in the form of a cover story, in which the general task of the situation becomes transparent. Secondly, the statistical information is given in probabilities, as this is the regular format of statistical information in these domains [13,63]. Additionally, providing the statistical information within the learning task is considered to be a means of scaffolding, as it reduces the complexity of the task. Thirdly, questions which may represent the different task classes are posed. In Figure 2, one of these contexts is given for medicine and law, respectively.
The training course presented is a short intervention of about one hour and, thus, is suited to one of the two learning tasks (SARS-CoV-2 self-tests or the breathalyzer test) presented in Figure 2. Both are suitable learning tasks for a first learning activity on Bayesian Reasoning, as they are relatively easy to understand (e.g., comprising few technical terms) and the statistical information is suitable. However, further learning tasks have also been developed, regarding medicine scenarios about coronavirus antibody tests, pregnancy self-tests, triple tests for the prenatal diagnosis of Down syndrome, mammography, bowel cancer screenings, and HIV self-tests. In the remaining learning tasks for the legal field, the validity of the following is addressed: polygraphs, facial recognition software, an algorithm named COMPAS (which is used to measure an offender’s future risk of recidivism), plagiarism checkers, paternity tests, and the effects of previous recidivism on future recidivism. For each domain, two further examples of learning tasks are added to the Supplementary Materials (File S1: S1_Additional_learning_tasks, https://osf.io/y3qaz/). They can be used to measure the effects of, or to extend, the training courses. In the supportive and procedural information, we use a more general task of the domain. The general task in medicine, for example, refers to an unspecified disease and an unspecified diagnosis test as opposed to a specific disease or a specific diagnostic test. In that way, the supportive and procedural information can easily be applied to any other learning task.
While the learning tasks are identical for all task classes, we split the description of the supportive information into two separate Section 3.2 (regarding “performance”) and Section 3.3 (regarding “covariation”).
3.2. Supportive Information on the Task Class of Performance: Mental Models and Worked Examples
Performance is the ability to compute a conditional probability in a Bayesian situation, such as the positive predictive value (e.g., that a person is actually ill, if (s)he tests positive) in a Bayesian situation (Section 2.1). This is the most basic aspect of Bayesian Reasoning, and therefore, is addressed first in the course of the training. It is triggered by the question about the probability of being infected with COVID-19, if a person tests positive in the so-called AEKSU.RAPID self-test (Figure 2).
3.2.1. Mental Models: Frequency-Based Double Trees and Unit Squares
In Section 2.2 and Section 2.3, arguments have been put forward that double trees and unit squares with frequencies are best for structuring Bayesian situations and should, therefore, be the basis of the mental models in a training course on Bayesian Reasoning. In Figure 3, we illustrate the design of these representations in a digital context.
To come up with even more supportive versions of the double tree and the unit square, we further applied principles of multimedia instruction [64]. For instance, research into common errors in Bayesian Reasoning with the different visualizations concluded that it is difficult to identify the “rows” in the unit square (e.g., both sets of the positively tested: false- and true-positive) as belonging together [42]. Therefore, we used Mayer’s signaling principle for the design of multimedia instruction, by highlighting the rows in the same color (e.g., green or blue) while only the intensity of the color (intense green or blue vs. light green or blue) was used for the column of the inner area [65]. Likewise, we used a salient method (coloring the inside of the nodes) in the double tree to highlight the set-relations in the lower half of the double tree, as this is harder to detect with the branches in the lower half crossing each other. We used a less obtrusive method (coloring the border of the nodes) to highlight the set-relations in the upper half of the double tree. Lastly, we present percentages as well as frequencies in the visualization. Displaying both sets of information serves the complementary function of representation [66], as the information provided in percentages and the more easily comprehensible frequencies are displayed simultaneously.
Using this visualization to calculate the positive predictive value requires correct identification of the relevant sets for the numerator and denominator of the positive predictive value (on the right in Figure 3). Using the relevant parts of the double tree or unit square to visualize this fraction can also support the calculation of (and serve as a mental model for) the positive predictive value [67]. The resulting visualizations of the fraction of the positive predictive value are a visualized (frequentist) version of Bayes’ formula, and complement the double tree and unit square as a mental model for the aspect of performance. We refer to them as a visualized fraction and display them in Figure 3 as well.
3.2.2. Cognitive Strategy: Worked Example
Previous research has shown that performance tasks are relatively easy when one of the above-mentioned ideal representations (double tree or unit square) is already provided [39]. However, in our training courses, the students learn to structure the Bayesian situation themselves by creating such a representation from scratch. This is important as, in authentic contexts such as those in our learning tasks, the professionals cannot rely on a provided or pre-set structure. Therefore, a cognitive strategy for creating the intended visualization is necessary. Consequently, we describe a worked example in which the students learn a systematic approach to creating and making use of these (mental) models. In doing so, the students learn to carry out three steps:
- Draw the structure of the visualization with the given information (draw structure);
- Translate the given probabilistic information into frequencies and add them to the visualization (add frequencies); and
- Calculate the required probability with the visualization (calculate solution).
These worked examples are produced digitally, similar to an interactive slide-show. In doing so, we make sure to carefully apply Mayer’s principles for the design of multimedia instruction [65]. For instance, the segmenting effect states that “people learn better when multimedia instructions are presented in (meaningful and coherent) learner-paced segments” [68] (p. 390). Thus, we implement the segmenting principle by allowing users to complete the different steps at their own pace. Based on findings that small segments produce greater learning results than larger ones [69], the segments are very short, mostly one sentence or less. Thus, the user always reads, in one small (coherent) segment, the next step for creating the visualization, and can instantly observe in the next segment how this is produced in the visualization. In this way, it is also possible to very closely connect textual descriptions with newly added elements in the visualization, in order to ensure spatial and temporal contiguity [65]. Moreover, we further emphasize this connection between the latest information in the text and in the visualization by using the signaling principle [70]. Accordingly, we always highlight new corresponding information (both in the text and the visualization) with the color purple. Based on the coherence principle, which suggests minimizing extraneous material, this color is not used elsewhere in the training course in order to maintain its symbolic character and keep the learning material consistent so as to reduce cognitive load [71]. The text or visualization parts are only colored in purple (signaling their correspondence) if they are the latest segment in the text or visualization. They turn black as a new segment on the same slide appears. This design-feature is also meant to reduce the split-attention effect [72] which means that temporal or spatial separation increases cognitive load and, therefore, may impede learning. These ideas are illustrated in Figure 4 for integrating two frequencies into the visualization (within step 2).
The small pieces of information in the learning material are grouped together in different levels: First, we refer to the smallest piece of information (which is added simultaneously) as a segment. Second, all segments that can be seen on one screen form a bigger unit, a slide (a slide is given in Figure 4). Third, one or multiple slides together form a step within the worked example (e.g., 1. Draw structure, 2. Add frequencies, 3. Calculate solution). At the end of one step, the user reaches a summary of the previous step. The summaries of the three steps of the whole worked example are illustrated in Figure 5. After having completed all three steps, the user arrives at a slide where all three summaries are presented again. These aspects of the worked example allow each participant to make use of it according to his or her individual and specific learning needs, which is another desirable aspect of learning material according to the 4C/ID model [21].
This worked example is embedded in a larger structure, with an introduction prior to the worked example and further notes after it. The type of knowledge that is learned is considered recurrent, and the input is described in Section 3.4 on procedural information.
The complete worked examples can be accessed in the Supplementary Materials (File S2: Worked_Examples, https://osf.io/y3qaz/).
Finally, another important aspect of supportive information in the 4C/ID model is cognitive feedback, which “consists of information (including prompts, cues and questions) which helps learners construct or reconstruct their cognitive schemas in such a way that future performance is improved” [21] (p. 276). We implemented such feedback for answers that the learners supplied while working on the learning tasks. This aspect is explained in more detail in Section 3.5 on whole-task practice.
3.3. Supportive Information for the Task Class of Covariation: Mental Models and Worked-Examples
Covariation is the ability to deal with functional covariation [25], and we understand it as an aspect of Bayesian Reasoning that is (if compared to performance) a higher-order ability of Bayesian Reasoning (Section 2.1). Due to the higher degree of complexity of covariation compared with performance, the content on covariation, according to the 4C/ID model, should be taught after the performance stage [21].
The aim of the training materials that address covariation is that the students learn to correctly evaluate the effects of changes to the three given parameters (false-positive rate , true-positive rate , and base rate ) on the positive predictive value. For example: Now, only those people are tested for whom the risk of being infected with COVID-19 is greater than stated in the original description of the situation (e.g., they have symptoms of cold and had contact with an infected person). How does this change the probability of being infected with COVID-19, if a person tests positive in the AEKSU.RAPID self-test? Assessing the influence of changes on the positive predictive value (as in the given question) naturally requires the knowledge of how to calculate it (which is learned within the task class of performance).
3.3.1. Mental Model: Dynamic Frequency-Based Double Trees and Unit Squares
Since determination of the positive predictive value was assigned to the previous task class with visualization as the mental model (Figure 3), this same mental model was, again, taken up and adapted for the task class of covariation. Again, the principles of multimedia learning [64] were considered when designing the digital versions of the mental models for learning about covariation. In order to make the changes to the three given parameters visible in the visualization, three sliders were added to the visualization (Figure 6). The sliders and the corresponding given parameter were produced in the same color, so that the signaling principle is taken into account here [70]. Due to the dynamization of the visualization, many numbers change simultaneously in the double tree. This can lead to cognitive overload [73], which is why, in the double tree, only the changing given parameter (in Figure 6 the false-positive rate) as well as the associated slider and three relevant frequencies (for the positive predictive value) are highlighted [65]. In the case of the unit square, highlighting was deliberately omitted, since the focus here is on the change in areas rather than exact changes in the numerical values.
In addition to visualization, the visualized fraction plays an important role. For this reason, the mental model of covariation consists of both elements: the dynamic visualization and the dynamic fraction. The fraction represents the positive predictive value and is already introduced in the task class of performance (Figure 3). The numbers (and also the areas in the case of the unit square) change if the slider is moved in the visualization and in the fraction (Figure 6). Additionally, in the case of the double tree, a second fraction of equal value is given, in which the number of positive tests (in the denominator) is also given as the sum of the false positives tested and true positives tested, in order to be able to show the individual components. This is not necessary with the unit square, because the areas of both of these sets are already represented in the denominator.
3.3.2. Cognitive Strategy: Worked Examples
Due to the dynamic of the mental model, explanatory videos were used as supportive information in the task class of covariation. Since there is a total of three given parameters (false-positive rate, true-positive rate and base rate) which can be changed, three explanatory videos were generated (one for the change in each parameter). In the explanatory videos, the dynamic visualization and dynamic (visualized) fraction are the central elements. All the videos contain two steps that are necessary for arriving at a solution for covariational tasks: 1. How do the relevant frequencies (or areas) change? 2. How does this change the (visualized) fraction? (Figure 7).
The order of the explanatory videos is (with respect to the 4C/ID model) in ascending order of complexity (Figure 7) [58]. The most challenging task is to evaluate base rate changes, because the two relevant frequencies (the false positives and the true positives) display an inversely proportional relationship. The change in the given parameters, as well as the change in relevant frequencies (or areas) in the visualization and in the fraction, are indicated by arrows (double tree) or transparency-altered areas (unit square) in order to complement the verbal representation of the change with a pictorial representation [74].
Furthermore, reinforcement of the complexity of the explanatory videos is implemented by the conceptual design. While the explanatory video for changing the false-positive rate works with a digital animation (all numbers and areas change), the explanatory video for changing the base rate works only with a sketch of the alterations (indicated by arrows or changed areas without actually changing the numbers). This is necessary, as in everyday life, you do not generally have a dynamic visualization at hand. Thus, the scaffolding is reduced between the first and last video to prevent dependence on the animation. Another conceptual change was added to the explanatory videos with a unit square for changing the true-positive rate: In this video, the absolute frequencies in the unit square were completely removed and thereby it was pointed out that it is sufficient to reason about covariation based on the changes of the areas without thinking about concrete numbers. As nothing except the numbers change in the double tree, this feature was only added in the video with unit squares (compare Figure 7, row 2).
When creating the explanatory videos, we not only pay attention to the implementation of Mayer’s principles [64], but also apply insights from research on the design of the explanatory videos:
In the videos, we use the modality principle, which suggests that instructors “present words as spoken rather than printed text” [65] (p. 765) in the videos. Certain studies highlight the dependence of the learning material on the modality effect, such as Schnotz et al. [75] who showed that the modality effect is stronger for picture-related information and weaker for content-related information. Hence, since the dynamic visualization and fraction (as picture-related information) are central in the videos on covariation, we consider the modality effect to be of particular importance here. The principle of temporal contiguity has also been implemented, which means that the spoken text should be presented at the same time as the associated animation [65]. During the implementation of the explanatory videos, attention was paid to pertinent quality criteria such as a clear structure, a connection to previous knowledge and an appropriate level of language and mathematization [76].
Each explanatory video is complemented by student activation, which positively influences learning success [77] and consists of using the interactive visualization (double tree or unit square) with sliders (Section 3.3.1) to make specific changes to one of the three parameters in a Bayesian situation.
The most significant indicator of learner engagement is the length of the video [78]. Longer videos are more likely to be aborted, and subsequent tasks are less likely to be completed. Therefore, a maximum duration of six minutes is recommended for individual explanatory videos, which we have used as a guideline [78]. The texts for the explanatory videos were recorded by two professional speakers. The speakers were not visible in the three videos, since empirical studies on similar content have not shown any positive effect on learning success [79,80].
3.4. Procedural Information: Facilitating Recurring Aspects in Bayesian Situations
We have identified five important pieces of recurrent information for our learning tasks that are relevant for the task classes of performance and covariation alike: First, the terms of the given parameters; these are often needed as they appear, for instance, in the technical information of medical tests and are necessary to quantify the Bayesian situation. In order to have the terms available at all times, their meaning can always be accessed through a click on the legend while working on the worked example in the task class of performance. We used the common terms in the domain, which is why we refer to the true-positive rate as ‘sensitivity’ and to the base rate as ‘prevalence’ in the training materials for medicine students. While defining the terms, we always made a reference from the general context (used in the procedural and supportive information) applied to the specific context (used as a learning task, e.g., on SARS-CoV-2 self-tests or breathalyzer tests).
Second, in order to make use of the unit square in any given situation, it is necessary to understand that the ratios in the unit square do not have to be absolutely correct as long as the proportions within the unit square remain roughly representative. This is illustrated by pointing it out in a sketch of the unit square just after the worked example, and also in the training course with the double tree.
Third, it is necessary to correctly interpret the textual phrasing of the given probabilities in order to correctly structure a Bayesian situation. It is well known that the wording of probabilities is often misleading for untrained people, and can easily result in the misinterpretation of a given probability [81]. Additionally, it has also been shown that in the context of Bayesian situations, the wording of probabilities affects performance [82]. Therefore, we have added input on the wording of probabilities in general, with special emphasis on conditional probabilities. Thus, the students also learn to relate statements of probabilities (e.g., “If a person is infected with SARS-CoV2, then the probability is 96% that this person tests positive.”) with a statement of proportions (e.g., “The proportion of infected people who test positive among all infected people is 96%”).
Fourth, it is necessary to correctly distinguish between the different kinds of probabilities that can occur in a Bayesian situation (marginal, conjunctive and conditional) [83]. This is especially important as the different kinds of probabilities are also often confused (Section 3.5.1, [84,85]). Thus, we explain the conceptual differences between these kinds of probabilities by pointing out their differences in the context and within the visualization. This also strengthens understanding of the visualization (Figure 8).
Fifth, the size of the imaginary sample should be large enough that the frequencies of the intersections (third level in the double tree/inner areas in the unit square) are whole numbers. The second to fifth pieces of recurrent information are presented after the worked example, just before the students try to imitate it for the first time when working on the learning task. In this way, we ensure that they can correctly interpret the given information.
Creating the visualization is recurrent in Bayesian tasks, as it is necessary in both task classes (performance and covariation). Therefore, it should be mentioned that steps 1 (draw structure) and 2 (add frequencies) of the worked example, which were presented in Section 3.2.2 on supportive information about performance, actually form part of the procedural information. Consequently, information on how to visualize the Bayesian situation in a double tree or unit square is also available when learning about covariation, but is now offered in the form of a short explanatory video at the beginning of this part of the training. At that point, the structure of the visualization and position of the given parameters within in the visualization are repeated.
3.5. Whole-Task Practice
The central approach of the 4C/ID model is that learning should take place in whole- and authentic-learning tasks [21]. In this section, we point out which methods of scaffolding were given while working on the learning tasks and what kind of corrective feedback (as part of the procedural information) and cognitive feedback (as part of the supportive information) is provided.
3.5.1. Practice of the Task Class of Performance
The students work on the learning task on SARS-CoV-2 self-tests (or breathalyzers) and, thus, the tasks that were used as an introduction for the training course.
While working with the tasks, one method of scaffolding is the implementation of a legend that summarizes the three steps of the worked example in a general context, as in Figure 5. The learners can click on this and use it while working on the learning task. The implementation of these legends is a means to gradually decrease the amount of supportive information provided as the learner’s expertise increases [21].
After entering a probability as a solution for the positive predictive value, the learners receive two kinds of feedback on their solutions: First, the learners receive a corrective feedback on the visualization they might have drawn for structuring the Bayesian situation in the learning task. Thus, they see a sketch of the complete visualization which displays the learning task about SARS-CoV-2 self-tests (or breathalyzers) with notes on how to create the visualization (Figure 9). Thereby, the learners can compare this (correct) visualization with the one they have constructed themselves, and can (in the event that they spot a mistake in their visualization) correct their result of the positive predictive value that was requested without the support of a correct visualization. As this provides an opportunity for learners to detect and correct their own mistakes, this is supposed to increase learning performance [86]. Subsequently, the learners receive cognitive feedback on their latest input (either the first one, if they did not choose to correct their first input, or the second one, if they modified their first answer).
The second round of feedback refers to errors that the learners show in their latest input. As stated previously, determining the positive predictive value with the double tree or the unit square often works very well. Yet, even in those cases, typical errors are revealed [42,87,88]. On top of that, further typical errors have been documented for Bayesian situations that are linked to probabilities or natural frequencies only [22,89] and regard medical experts especially [90]. Moreover, it is suggested that learning about typical errors in a problem-solving context can promote learning [91], and feedback on errors helps learners to become aware of, and reduce, knowledge gaps [92]. As a consequence, we provide two kinds of error-specific information:
First, every learner receives individual feedback on the strategy used (based on the numerical input) to calculate the positive predictive value. If the input was incorrect, the feedback on that misleading strategy is then always structured as follows:
- An explanation of how the correct solution could have been calculated by using the visualization (double tree or unit square) correctly;
- A statement about which error has been made in the calculation, e.g., “You have calculated 48/50”;
- An explanation of why this is wrong, e.g., “Therefore, you did not calculate how many of those tested positive are actually infected with SARS-CoV-2, but how many of those infected correctly test positive”;
- An explanation of which probability has, thereby, been calculated, e.g., “The probability which you have calculated is: The probability that a person tests positive, if (s)he is infected with SARS-CoV-2 (=48/50 = 96%) and this is the sensitivity”.
Second, every learner (no matter what their correct or incorrect answer was) receives input on the two most common mistakes in Bayesian Reasoning, irrespective of which visualization was used to structure the Bayesian situation: Fisherian and Joint occurrence [42,87]. Fisherian means that the event and conditions are confused (as in our example above), thus indicating the sensitivity, , as a correct solution to the positive predictive value, . Joint occurrence means confusing a conditional with a joint probability, e.g., indicating the probability of being ill and testing positive, , with the probability of the positive predictive value, .
3.5.2. Practice of the Task Class of Covariation
The students still work on the learning task of SARS-CoV-2 self-tests (or breathalyzers), but now assess the effects of changes to given parameters (false- and true-positive rate, and base rate) on the positive predictive value and the two conjunctive probabilities that are needed for calculating the positive predictive value (true- and false-positives).
Again, one means of scaffolding is the availability of legends, which the students can use while working on these tasks. This time, the legends consist of two screenshots of the explanatory videos for the changes in each given parameter (false-positive rate, true-positive rate and base rate, respectively): the first picture is a variation of the altered parameter to its extremes in the form of a table, with the visualization and visualized fraction for the given parameter having a value of 0%, 50% and 100% (Figure 10); the second picture displays a structural overview on changes in the visualization and visualized fraction, and the consequences (Figure 7). While working on the task, the students are encouraged to use and adapt the (corrected) visualization which they have used for the task on performance.
Another means of scaffolding is the opportunity to use an interactive visualization with sliders for each of the given parameters, after having answered the questions for the first time. In this way, the students can double-check whether they have correctly assessed the changes within the visualization. Afterwards, they may correct their first answer, which was demanded without the support of an interactive visualization.
Afterwards, the students, again, receive two kinds of feedback: first, corrective feedback in which the wording of the described change in the Bayesian situation (e.g., “the probability that a person tests positive, if this person is not infected with SARS-CoV-2, is smaller”) is linked to the respective feature in the visualization (e.g., “the horizontal division of the right column moves up”). The corrective feedback is provided through written text with the visualization, where the feature that changes is highlighted. Second, the students receive cognitive feedback on their answer. They are told whether their answer was correct or not. In addition, there is a short (max. 1 min 45 s) explanatory video for each question explaining the impact of the parameter change, both on the visualization and on the respective fraction. If a person has provided the correct answer to the previous slide, they can watch the video, but are not required to do so. The video must be watched only if an incorrect answer was offered.
4. Formative Evaluation of the Training Courses
To evaluate the training courses described above, we carried out a formative evaluation, which can be “defined as a process of systematically trying out instructional materials with learners in order to gather information and data that will be used to revise the materials” [93] (p. 311). Our formative evaluation was performed after the development of the training courses, and used for potential optimization of the training courses and a later field study. A total of 16 students (eight medical and eight law students) tested the materials that we created. Thus, they worked:
- on three of the learning tasks (Section 3.1) without any instruction in the beginning (phase 1);
- with the materials of the training courses regarding the aspect of performance with the supportive and procedural information (phase 2);
- with the materials of the training courses regarding the aspect of covariation with the supportive and procedural information (phase 3); and
- on four of the learning tasks (Section 3.1) without the material of the training courses (phase 4).
Between each of these four phases, the participants took part in interviews to systematically validate important aspects of the design of the material. In the following sections, the results for each of these phases are reported, based on quantitative data (in the form of participants’ inputs, available as Table S3: S3_Quantitative_Data in the Supplementary Materials, https://osf.io/y3qaz/) and qualitative data (in form of participants’ feedback in the interviews and notes, available as File S4: S4_Notes_participants in the Supplementary Materials, https://osf.io/y3qaz/). Note that some of the interviews between the four phases lasted a long time and, thus, 3 of the 16 students did not finish phase 4.
In the interviews after phase 1, the authenticity of the learning tasks was addressed. The feedback from the students showed that the situations in the learning tasks are generally perceived as authentic situations relevant to their future profession. Out of the 16 students, 12 did not observe anything striking or conspicuous within the learning task at all. The other four students mentioned difficulties with details such as technical terms. Thus, we double-checked those terms again with experts from the domain. Nothing conspicuous was noticed in the learning tasks on SARS-CoV-2 self-tests and breathalyzer tests, apart from the value of the false-positive rate of the breathalyzer test, which was surprisingly large in the opinion of two of the students. As we had retrieved these values from a validation study of the breathalyzer tests [94], we did not make any adaptions.
Moreover, we evaluated the responses to the questions in the learning tasks in phase 1. Bearing in mind that the students were untrained, a surprisingly large number of students (at least of medicine) were able to correctly calculate conditional probabilities in a Bayesian situation (aspect of performance) from the outset. In Table 2, the number of people who can correctly determine the positive predictive value is provided for each of the three tasks. In one of the three learning tasks (L3), the students also worked on tasks on the aspect of covariation and assessed the influence of the false-positive rate (C1), the true-positive rate (C2) and the base rate (C3). The number of correct answers to the tasks on the aspect of covariation in phase 1 is also provided in Table 2.
After phase 2, in which the participants used the worked example on performance and worked on a task of performance themselves, we analyzed the worked example for the task class of performance with the students in the interview. When asked whether there were any difficult steps or things that were hard to understand, 13 students could not think of anything. On the contrary, many explicitly pointed out how much they enjoyed the worked example (e.g., one student pointed out that she wished that this was how she had learned about stochastics). Two students remarked on details that confused or irritated them (e.g., the wording of certain passages). We used this feedback to adapt these passages. One student mentioned the difficulty of engaging with the new concept of the unit square in general, as this student was already familiar with another technique (using 2 × 2 tables) with which she could solve the tasks. However, this student later (after having watched the explanatory videos on covariation) appreciated the unit squares, especially for assessing the influence of changes, as this is so easily observable with this method.
Additionally, the implementation of the design principles in the worked example was perceived positively; all 16 students found the use of the color purple to signal something new and the segmenting of new information in text, and afterwards in the visualization, very helpful. Furthermore, we discussed the students’ use of the different technological features, such as the opportunity to use the legends after phase 2. While four students used the legends with the technical terms, 6 of the 12 people who did not use the legend stated that they had noted the technical terms on their sheets of paper and, therefore, did not need the legend, but appreciated the chance to look up the terms if necessary. We have now also implemented a feature in the digital environment that automatically tracks how often, and when, the students access the legend.
Most of the students used the supportive information of the worked examples while working on the learning task themselves. This can be observed in the students’ notes, in which 14 of the 16 students drew the visualization of the supportive information afterwards (see examples in Figure 11). After having gone through this information, 13 of the 16 students were able to correctly calculate the positive predictive value (Table 2). Two students used the opportunity to correct their first input after having compared their own visualization with the correct one. While one student was slightly confused by the opportunity to correct his first response, another student explicitly described this opportunity as motivating. As the input of the students showed that this feature only led to an improvement of the first response, but never to erroneous dismissal of a correct first answer, we are maintaining this feature. All 16 students stated that they received suitable and helpful feedback to their answer. It was also mentioned that this feedback was encouraging for the continuation of work on the learning task.
After phase 3, in which the participants watched the explanatory videos for the aspect of covariation and worked on the covariation tasks themselves, we assessed which aspects, in the students’ opinions, were more or less helpful within the videos. Among others, the students commented positively on the fact that it was possible to watch how the visualization changes in the video and also to observe the changes in the visualized fraction. We explicitly asked for the students’ impression of the visualized fraction, as this is a somewhat unconventional representation of a fraction. However, none of the students declared that they were irritated by this. On the contrary, regarding the visualized fraction of the unit square, students found it intuitive and easy to understand, and one student even pointed out that this visualized fraction is of special help for a person who “thinks illogically”, as the changes in the fraction can easily be observed. Moreover, the students acknowledged the (“pleasantly slow”) speed of the spoken text as it was easy to follow, and the repetition of technical terms in the first video, as well as the alternation between a male and female speaker, which increased variation within the videos. Some students found the videos a little tedious and, also pointed out that the tasks between the videos could vary more. Thus, we modified these tasks. Previously, the tasks were always to maximize the positive predictive value (by a change in one of the given parameters); however, now, in the adapted versions, we ask participants to first maximize the positive predictive value (by changing the false-positive rate), then to minimize it (by changing the true-positive rate), and finally, to set the value of the positive predictive value to approximately 50% (by changing the base rate).
When we first implemented the formative evaluation, all the videos of feedback to the exercises on covariation had to be watched, even if one’s own answer was correct (which is different to how we described the material in Section 3.5.2). This feature was perceived negatively, as the students found it to be frustrating, exhausting and not beneficial for their learning. Therefore, we adapted this feature during the evaluation. Later (as explained in Section 3.5.2), students were only obliged to watch the videos to those questions that they answered incorrectly. This was received much more positively, and students also confirmed that watching the videos to the questions they had answered incorrectly helped them to spot their “thinking barrier”. Additionally, one student reported having watched all the videos voluntarily (“out of curiosity”, as she stated), even though she did not answer incorrectly. However, two students still found the obligation to watch the videos (to answers which were incorrect) annoying, as they claimed to have recognized their error at the very beginning of the video and, thus, did not feel that they benefitted from watching the whole video. However, as the videos are short (on average 1–2 min) we decided to maintain this feature.
Lastly, in this phase, we were also able to observe that the students used the supportive information, as we can see in their notes that they have applied what was learned in the explanatory videos (e.g., compare the arrows that indicate the “movement” of the divisions in the unit square and the changes in the frequencies in the nodes of the double tree in Figure 12). The quantitative data also suggest that students understood the tasks of covariation, as 13, 15 and 12 of the 16 students gave correct answers to the questions on changes in the false-positive, true-positive and base rate, respectively (Table 2).
In phase 4, the students, again, worked independently on learning tasks, and answered questions without having the learning material of phases 2 and 3 at hand. Therefore, comparisons between the proportions of correct answers between phase 1 and phase 4 can illustrate the learning effect of the training courses. As the interviews before phase 4 with some of the students were quite long, two students were obliged to drop out before phase 4, and one student during phase 4. The results of the remaining students’ work in phase 4 are summarized in Table 2. With regard to the aspect of performance, all medical students were able to correctly calculate the positive predictive value on almost all the tasks, and a significantly larger proportion of law students answered correctly as compared to the learning tasks in phase 1. This is an encouraging result with regard to the learning effect on the aspect of performance, as it shows that the proportion of students who can correctly calculate conditional probabilities significantly increased, and this skill can also be transferred to new Bayesian problems. Moreover, the proportion of correct answers on the learning task that addressed a context outside of one’s own professional domain (T1) indicates that the acquired skills in Bayesian Reasoning can also be adapted to contexts from an unfamiliar professional domain. The knowledge gained about the aspect of covariation seems to have been greater for the students of medicine, where the proportion of correct answers almost doubled compared to those of the students of law, whose proportion of correct answers only improved marginally. This might be due to the fact that the law students answered the tasks on covariation surprisingly well from the outset (compare the results of phase 1).
Overall, the observations of the students and their feedback suggest that, despite a few detailed adjustments, the materials of the training courses were useful and supportive for working on the learning tasks. Moreover, the learning tasks themselves were perceived as authentic, which, again, increased the motivation of students to learn how to reason in a Bayesian manner within their domain. This is also highlighted by the suggestion of a law student: “I can only recommend participating in the training course! You learn a simple schema on how to easily solve questions which seem complicated in the beginning”; and the recommendation of a medicine student to take part in the training course: “You can learn a lot about the validity of a medical diagnostic test. This is surely going to help you later, for example when breaking news to patients. By taking part in the training, I have gained a long-term understanding about contents which were only briefly touched upon or not mentioned at all in my studies before.”
5. Discussion and Conclusions
Developing an evidence-based training course on Bayesian Reasoning requires the identification and evaluation of relevant prior research before combining it meaningfully within an adequate instructional approach. Actually, prior research on Bayesian Reasoning identified two main successful strategies: firstly, using natural frequencies as the format of the statistical information, and secondly, structuring the Bayesian situation with an adequate visualization (i.e., double tree or unit square). On one hand, we used these two strategies to support the learning of how to perform in Bayesian situations, as the related research suggested. However, on the other hand, we also used both strategies for learning covariation in a Bayesian situation that had not previously been addressed in training courses for Bayesian Reasoning.
We also explicitly based our two training courses on a promising instructional approach, the 4C/ID model, which we used to train the different aspects of Bayesian Reasoning by combining the before-mentioned successful strategies. This instructional approach guided several decisions about the structure and content of our training course. For instance, use of the 4C/ID model made it necessary to develop real-life-based authentic learning tasks, which we evolved by working together with experts from the field of medicine and law. Furthermore, supportive and procedural information needed to be created in order to facilitate the learning within the learning tasks. The prior research on Bayesian Reasoning (e.g., successful strategies, common errors) guided our decisions on conceptualizing the supportive and procedural information.
A further key consideration in the development of our training courses was the opportunity to locally apply further findings of research in psychology or mathematics education, if these findings are found to promote mathematical learning. For example, we have applied Mayer’s principles for the design of multimedia instruction (e.g., signaling and segmenting), the instructional method of worked examples and research on explanatory videos. Additionally, we used worked examples [61] because they were found to promote learning. This local use of research findings was a complementary consideration for developing evidence-based training.
However, the development of our evidence-based training course did not rely on theoretical considerations only. Thus, conducting a formative evaluation including in-depth investigations of the thoughts and actions of the users of our training courses was part of the development, and led to optimization of the training courses. In the interviews, which were part of the evaluation, the students confirmed that the learning tasks were authentic. Thus, it was possible to prove the coherence between experts’ considerations about contexts and their acceptance by the users of the training courses.
Moreover, the results and feedback suggest that the supportive and procedural information was helpful, as most of the students applied this information and also worked more successfully on the learning tasks after the training. Furthermore, they judged the training course to be an enrichment of what they had learned in university, and appreciated having taken part in it. Thus, the structure based on the 4C/ID model was also acknowledged by the users of our training courses. In addition, the findings concerning the learning materials of the students as well as the results gave initial evidence that the training course is effective.
Although the insights of the formative evaluation represent qualitative feedback only, they helped us to adjust certain features within the training courses. After adjusting our training courses according to the lessons learned from the present paper, we have already carried out a study with more than 500 participants from medicine or law and with a control group to analyze training effects in a quantitative way. In this main study, the two training courses extensively described in the present paper are the two experimental conditions with “maximal expectations”. Additionally, there were two further control training conditions, one that solely uses the strategy of natural frequencies (without a visualization), and another that solely uses the strategy of a visualization (without the promising natural frequencies). A control group (waiting condition) completed the experimental design. In that study, we carried out a pre- and a post-test as well as a follow-up test 8 to 12 weeks after the training to identify long-term learning effects. For the results of the main study regarding a sample of more than 500 students of medicine or law, see [95] or [96], or visit our project website [97]. However, the results of this field study are beyond the scope of this current paper, which is centered on the development of the training courses.
Apart from that, the training courses presented could also be easily adapted to extend the training, by increasing the complexity of the learning tasks and reducing the scaffolding, or to tailor them to another group of participants. For example, in order to reduce the scaffolding within a learning task, the statistical information may be omitted so that the learners first have to gather them, as in a real-life scenario. Additionally, the aspect of the communication of Bayesian Reasoning could be integrated into the training courses. Finally, for further stages of the training program, it would be beneficial to also offer learning tasks with high physical fidelity and an opportunity for interaction, for example, working on a real diagnostic problem with a real patient. This would link the different tasks even more closely and is, therefore, only suitable for a more advanced learner. In order to tailor the training courses to a different group of participants (e.g., from a different professional background), new learning tasks would have to be generated to establish an authentic learning environment for this group of participants.
To conclude, the main aim of this paper was to provide some insight on how to foster Bayesian Reasoning with evidence-based training, by taking into account prior research on the topic itself and on instructional methods. Likewise, as pointed out by a law student who was one of the participants in the formative evaluation, the presented training courses on Bayesian Reasoning are a complementary asset to what is regularly learned at university: “The training course is an excellent enrichment of the regular courses. The well-designed input on statistics helps to better understand common practices in law and also broaden one’s general education.”
Supplementary Materials
The following supporting information can be downloaded at: https://osf.io/y3qaz/, File S1: S1_Additional_learning_tasks; File S2: S2_Worked_examples; Table S3: S3_Quantitative_data; File S4: S4_Notes_participants.
Author Contributions
Conceptualization, K.B., K.B.-L., T.B., A.E., S.K., N.S. and M.V.; methodology, K.B., K.B.-L., T.B., A.E., S.K., N.S. and M.V.; formal analysis, T.B.; investigation, T.B. and N.S.; resources, T.B. and N.S.; data curation, T.B. and N.S.; writing—original draft preparation, T.B., A.E. and N.S.; writing—review and editing, K.B., K.B.-L., S.K. and M.V.; visualization, N.S.; supervision, K.B., K.B.-L., A.E., S.K. and M.V.; project administration, T.B. and N.S.; funding acquisition, A.E. and S.K. All authors have read and agreed to the published version of the manuscript.
Funding
This research was funded by DEUTSCHE FORSCHUNGSGEMEINSCHAFT (DFG), EIC773/4-1.
Institutional Review Board Statement
All subjects gave their informed consent for inclusion before they participated in the study. The study was conducted in accordance with the Declaration of Helsinki, and the protocol was approved by the Ethics Committee of the University of Kassel (project identification code: zEK-18).
Informed Consent Statement
Informed consent was obtained from all subjects involved in the study.
Data Availability Statement
The data presented in this study are openly available in OSF at https://doi.org/10.17605/OSF.IO/Y3QAZ, or https://osf.io/y3qaz/.
Acknowledgments
We would like to give special thanks to all the students who supported the development of the training courses: Archili Sakevarashvili wrote the codes for the digital realization of our training materials; Johanna Merkes, Marita Graf, Julia Ziegler and Marei Lehner all supported us in the recording of the visuals of the explanatory videos, and Yannik Merz and Julia Malzacher recorded the audios for the explanatory videos. Eva Schulz played the part of the doctor and attorney in videos, which depict communication in a Bayesian situation.
Conflicts of Interest
The authors declare no conflict of interest. The funders had no role in the design of the study; in the collection, analyses, or interpretation of data; in the writing of the manuscript; or in the decision to publish the results.
References
- De Finetti, B. Theory of Probability: A Critical Introductory Treatment, 1st ed.; John Wiley & Sons: Chichester, UK; Hoboken, NJ, USA, 2017; ISBN 978-111-928-637-0. [Google Scholar]
- Gelman, A. Bayesian Data Analysis, 3rd ed.; CRC Press: Hoboken, NJ, USA, 2013; ISBN 978-143-984-095-5. [Google Scholar]
- McGrayne, S.B. The Theory That Would Not Die: How Bayes’ Rule Cracked the Enigma Code, Hunted Down Russian Submarines, & Emerged Triumphant from Two Centuries of Controversy; Yale University Press: New Haven, CT, USA, 2011; ISBN 978-030-018-822-6. [Google Scholar]
- Ashby, D. Bayesian statistics in medicine: A 25 year review. Stat. Med. 2006, 25, 3589–3631. [Google Scholar] [CrossRef]
- Satake, E.; Murray, A.V. Teaching an Application of Bayes’ Rule for Legal Decision-Making: Measuring the Strength of Evidence. J. Stat. Educ. 2014, 22. [Google Scholar] [CrossRef] [Green Version]
- Hoffrage, U.; Hafenbrädl, S.; Bouquet, C. Natural frequencies facilitate diagnostic inferences of managers. Front. Psychol. 2015, 6, 642. [Google Scholar] [CrossRef]
- Kahneman, D.; Slovic, P.; Tversky, A. (Eds.) Judgment under Uncertainty: Heuristics and Biases, 1st ed.; Cambridge University Press: Cambridge, UK, 1982; ISBN 978-052-128-414-1. [Google Scholar]
- Gigerenzer, G.; Hoffrage, U. How to improve Bayesian reasoning without instruction: Frequency formats. Psychol. Rev. 1995, 102, 684–704. [Google Scholar] [CrossRef]
- McDowell, M.; Jacobs, P. Meta-analysis of the effect of natural frequencies on Bayesian reasoning. Psychol. Bull. 2017, 143, 1273–1312. [Google Scholar] [CrossRef]
- Cosmides, L.; Tooby, J. Are humans good intuitive statisticians after all? Rethinking some conclusions from the literature on judgment under uncertainty. Cognition 1996, 58, 1–73. [Google Scholar] [CrossRef]
- Eddy, D.M. Probabilistic reasoning in clinical medicine: Problems and opportunities. In Judgment under Uncertainty: Heuristics and Biases; Kahneman, D., Slovic, P., Tversky, A., Eds.; Cambridge University Press: Cambridge, UK, 1982; pp. 249–267. ISBN 978-052-128-414-1. [Google Scholar]
- Gigerenzer, G. Calculated Risks: How to Know When Numbers Deceive You; Simon & Schuster: New York, NY, USA, 2002; ISBN 074-320-556-1. [Google Scholar]
- Schneps, L.; Colmez, C. Math on Trial: How Numbers Get Used and Abused in the Courtroom, 1st ed.; Basic Books: New York, NY, USA, 2013; ISBN 978-046-503-292-1. [Google Scholar]
- Stine, G.J. Acquired Immune Deficiency Syndrome: Biological, Medical, Social, and Legal Issues; Prentice Hall: Upper Saddle River, NJ, USA, 1996. [Google Scholar]
- Johnson, E.D.; Tubau, E. Comprehension and computation in Bayesian problem solving. Front. Psychol. 2015, 6, 938. [Google Scholar] [CrossRef] [Green Version]
- Hoffrage, U.; Krauss, S.; Martignon, L.; Gigerenzer, G. Natural frequencies improve Bayesian reasoning in simple and complex inference tasks. Front. Psychol. 2015, 6, 1473. [Google Scholar] [CrossRef] [Green Version]
- Binder, K.; Krauss, S.; Bruckmaier, G.; Marienhagen, J. Visualizing the Bayesian 2-test case: The effect of tree diagrams on medical decision making. PLoS ONE 2018, 13, e0195029. [Google Scholar] [CrossRef] [Green Version]
- Brase, G.L. Pictorial representations in statistical reasoning. Appl. Cogn. Psychol. 2009, 23, 369–381. [Google Scholar] [CrossRef]
- Binder, K.; Krauss, S.; Bruckmaier, G. Effects of visualizing statistical information—An empirical study on tree diagrams and 2 × 2 tables. Front. Psychol. 2015, 6, 1186. [Google Scholar] [CrossRef]
- Sirota, M.; Kostovičová, L.; Vallée-Tourangeau, F. How to train your Bayesian: A problem-representation transfer rather than a format-representation shift explains training effects. Q. J. Exp. Psychol. 2015, 68, 1–9. [Google Scholar] [CrossRef]
- Van Merriënboer, J.J.G.; Kirschner, P.A. Ten Steps to Complex Learning: A Systematic Approach to Four-Component Instructional Design, 2nd ed.; Routledge: New York, NY, USA, 2013; ISBN 978-020-309-686-4. [Google Scholar]
- Zhu, L.; Gigerenzer, G. Children can solve Bayesian problems: The role of representation in mental computation. Cognition 2006, 98, 287–308. [Google Scholar] [CrossRef] [PubMed] [Green Version]
- Borovcnik, M. Multiple Perspectives on the Concept of Conditional Probability. Av. Investig. Educ. Mat. 2012, 2, 5–27. [Google Scholar] [CrossRef] [Green Version]
- Böcherer-Linder, K.; Eichler, A. The Impact of Visualizing Nested Sets. An Empirical Study on Tree Diagrams and Unit Squares. Front. Psychol. 2017, 7, 2026. [Google Scholar] [CrossRef] [Green Version]
- Leinhardt, G.; Zaslavsky, O.; Stein, M.K. Functions, Graphs, and Graphing: Tasks, Learning, and Teaching. Rev. Educ. Res. 1990, 60, 1–64. [Google Scholar] [CrossRef]
- Ayalon, M.; Wilkie, K.J. Exploring secondary students’ conceptualization of functions in three curriculum contexts. J. Math. Behav. 2019, 56, 100718. [Google Scholar] [CrossRef]
- Thompson, P.W.; Carlson, M.P. Variation, covariation, and functions: Foundational ways of thinking mathematically. In Compendium for Research in Mathematics Education; National Council of Teachers of Mathematics: Reston, VA, USA, 2017; pp. 421–456. [Google Scholar]
- Niss, M.; Højgaard, T. Mathematical competencies revisited. Educ. Stud. Math. 2019, 102, 9–28. [Google Scholar] [CrossRef]
- Wild, C.J.; Pfannkuch, M. Statistical Thinking in Empirical Enquiry. Int. Stat. Rev. 1999, 67, 223–248. [Google Scholar] [CrossRef]
- Gal, I. Adults’ Statistical Literacy: Meanings, Components, Responsibilities. Int. Stat. Rev. 2002, 70, 1–25. [Google Scholar] [CrossRef]
- Buckman, R.A. Breaking bad news: The S-P-I-K-E-S strategy. Community Oncol. 2005, 2, 138–142. [Google Scholar] [CrossRef]
- Brinktrine, R.; Schneider, H. Juristische Schlüsselqualifikationen: Einsatzbereiche—Examensrelevanz—Examenstraining; Springer: Berlin, Germany, 2008; ISBN 978-354-048-698-5. [Google Scholar]
- Bromme, R.; Nückles, M.; Rambow, R. Adaptivity and anticipation in expert-laypeople communication. In Psychological Models of Communication in Collaborative Systems; Brennan, S.E., Ed.; AAAI Press: Menlo Park, CA, USA, 1999; pp. 17–24. ISBN 978-157-735-105-4. [Google Scholar]
- Frerejean, J.; Merriënboer, J.J.G.; Kirschner, P.A.; Roex, A.; Aertgeerts, B.; Marcellis, M. Designing instruction for complex learning: 4C/ID in higher education. Eur. J. Educ. 2019, 54, 513–524. [Google Scholar] [CrossRef] [Green Version]
- Krauss, S.; Weber, P.; Binder, K.; Bruckmaier, G. Natürliche Häufigkeiten als numerische Darstellungsart von Anteilen und Unsicherheit—Forschungsdesiderate und einige Antworten. J. Math. Didakt. 2020, 41, 485–521. [Google Scholar] [CrossRef]
- Kleiter, G.D. Natural Sampling: Rationality without Base Rates. In Contributions to Mathematical Psychology, Psychometrics, and Methodology; Fischer, G.H., Ed.; Springer: New York, NY, USA, 1994; pp. 375–388. ISBN 978-038-794-169-1. [Google Scholar]
- Brase, G. What facilitates Bayesian reasoning? A crucial test of ecological rationality versus nested sets hypotheses. Psychon. Bull. Rev. 2021, 28, 703–709. [Google Scholar] [CrossRef]
- Böcherer-Linder, K.; Eichler, A.; Vogel, M. The impact of visualization on flexible Bayesian reasoning. AIEM 2017, 25–46. [Google Scholar] [CrossRef] [Green Version]
- Böcherer-Linder, K.; Eichler, A. How to Improve Performance in Bayesian Inference Tasks: A Comparison of Five Visualizations. Front. Psychol. 2019, 10, 267. [Google Scholar] [CrossRef] [Green Version]
- Binder, K.; Krauss, S.; Schmidmaier, R.; Braun, L.T. Natural frequency trees improve diagnostic efficiency in Bayesian reasoning. Adv. Health Sci. Educ. 2021, 26, 847–863. [Google Scholar] [CrossRef]
- Sloman, S.A.; Over, D.; Slovak, L.; Stibel, J.M. Frequency illusions and other fallacies. Organ. Behav. Hum. Decis. Processes 2003, 91, 296–309. [Google Scholar] [CrossRef]
- Eichler, A.; Böcherer-Linder, K.; Vogel, M. Different Visualizations Cause Different Strategies When Dealing With Bayesian Situations. Front. Psychol. 2020, 11, 1897. [Google Scholar] [CrossRef]
- Khan, A.; Breslav, S.; Glueck, M.; Hornbæk, K. Benefits of visualization in the Mammography Problem. Int. J. Hum.-Comput. Stud. 2015, 83, 94–113. [Google Scholar] [CrossRef]
- Bea, W. Stochastisches Denken: Analysen aus Kognitionspsychologischer und Didaktischer Perspektive; Lang: Frankfurt am Main, Germany, 1995; ISBN 363-148-844-0. [Google Scholar]
- Chow, A.F.; van Haneghan, J.P. Transfer of solutions to conditional probability problems: Effects of example problem format, solution format, and problem context. Educ. Stud. Math. 2016, 93, 67–85. [Google Scholar] [CrossRef]
- Kurzenhäuser, S.; Hoffrage, U. Teaching Bayesian Reasoning: An evaluation of a classroom tutorial for medical students. Med. Teach. 2009, 24, 516–521. [Google Scholar] [CrossRef] [PubMed]
- Ruscio, J. Comparing Bayes’s theorem to frequency-based approaches to teaching Bayesian reasoning. Teach. Psychol. 2003, 30, 325–328. [Google Scholar]
- Sedlmeier, P.; Gigerenzer, G. Teaching Bayesian reasoning in less than two hours. J. Exp. Psychol. Gen. 2001, 130, 380–400. [Google Scholar] [CrossRef]
- Starns, J.J.; Cohen, A.L.; Bosco, C.; Hirst, J. A visualization technique for Bayesian reasoning. Appl. Cognit. Psychol. 2019, 33, 234–251. [Google Scholar] [CrossRef]
- Steckelberg, A.; Balgenorth, A.; Berger, J.; Mühlhauser, I. Explaining computation of predictive values: 2 × 2 table versus frequency tree. A randomized controlled trial ISRCTN74278823. BMC Med. Educ. 2004, 4, 13. [Google Scholar] [CrossRef] [Green Version]
- Talboy, A.N.; Schneider, S.L. Improving Accuracy on Bayesian Inference Problems Using a Brief Tutorial. J. Behav. Dec. Mak. 2017, 30, 373–388. [Google Scholar] [CrossRef]
- Wassner, C. Förderung Bayesianischen Denkens: Kognitionspsychologische Grundlagen und Didaktische Analysen; Franzbecker: Hildesheim, Germany, 2004. [Google Scholar]
- Maggio, L.A.; Cate, O.T.; Irby, D.M.; O’Brien, B.C. Designing evidence-based medicine training to optimize the transfer of skills from the classroom to clinical practice: Applying the four component instructional design model. Acad. Med. J. Assoc. Am. Med. Coll. 2015, 90, 1457–1461. [Google Scholar] [CrossRef]
- Wopereis, I.; Frerejean, J.; Brand-Gruwel, S. Information Problem Solving Instruction in Higher Education: A Case Study on Instructional Design. In Information Literacy: Moving Toward Sustainability, Proceedings of the Third European Conference, ECIL 2015, Tallinn, Estonia, 19–22 October 2015; Revised Selected Papers; Kurbanoğlu, S., Boustany, J., Špiranec, S., Grassian, E., Mizrachi, D., Roy, L., Eds.; Springer: Cham, Switzerland, 2015; pp. 293–302. ISBN 978-331-928-197-1. [Google Scholar]
- Sarfo, F.K.; Elen, J. Developing technical expertise in secondary technical schools: The effect of 4C/ID learning environments. Learn. Environ. Res. 2007, 10, 207–221. [Google Scholar] [CrossRef]
- Martinez-Mediano, C.; Rioperez Losada, N. Internet-Based Performance Support Systems in Engineering Education. IEEE Rev. Iberoam. Tecnol. Aprendiz. 2017, 12, 86–93. [Google Scholar] [CrossRef]
- Costa, J.M.; Miranda, G.L.; Melo, M. Four-component instructional design (4C/ID) model: A meta-analysis on use and effect. Learn. Environ. Res. 2021, 2021, 1–19. [Google Scholar] [CrossRef]
- Van Merriënboer, J.J.G.; Clark, R.E.; Croock, M.B.M. Blueprints for complex learning: The 4C/ID-model. Educ. Technol. Res. Dev. 2002, 50, 39–61. [Google Scholar] [CrossRef]
- Van Merriënboer, J.J.G.; Seel, N.M.; Kirschner, P.A. Mental Models as a New Foundation for Instructional Design. Educ. Technol. 2002, 42, 60–66. [Google Scholar]
- Clark, R.C.; Nguyen, F.; Sweller, J. Efficiency in Learning: Evidence-Based Guidelines to Manage Cognitive Load; John Wiley & Sons: Hoboken, NJ, USA, 2011; ISBN 978-111-804-674-6. [Google Scholar]
- Renkl, A. The Worked Examples Principle in Multimedia Learning. In The Cambridge Handbook of Multimedia Learning, 2nd ed.; Mayer, R.E., Ed.; Cambridge University Press: Cambridge, UK, 2014; pp. 391–412. ISBN 978-113-954-736-9. [Google Scholar]
- Van Merriënboer, J.J.G.; Kester, L. The Four-Component Instructional Design Model: Multimedia Principles in Environments for Complex Learning. In The Cambridge Handbook of Multimedia Learning, 2nd ed.; Mayer, R.E., Ed.; Cambridge University Press: Cambridge, UK, 2014; pp. 104–148. ISBN 978-113-954-736-9. [Google Scholar]
- Kirkwood, B.R.; Sterne, J.A.C. Essential Medical Statistics, 2nd ed.; Blackwell Publishing: Malden, MA, USA, 2003; ISBN 978-144-439-284-5. [Google Scholar]
- Mayer, R.E. (Ed.) The Cambridge Handbook of Multimedia Learning, 2nd ed.; Cambridge University Press: Cambridge, UK, 2014; ISBN 978-113-954-736-9. [Google Scholar]
- Mayer, R.E. Applying the Science of Learning: Evidence-Based Principles for the Design of Multimedia Instruction. Am. Psychol. 2008, 63, 760–769. [Google Scholar] [CrossRef] [Green Version]
- Ainsworth, S. DeFT: A conceptual framework for considering learning with multiple representations. Learn. Instr. 2006, 16, 183–198. [Google Scholar] [CrossRef]
- Eichler, A.; Vogel, M. Teaching Risk in School. Math. Enthus. 2015, 12, 168–183. [Google Scholar] [CrossRef]
- Rey, G.D.; Beege, M.; Nebel, S.; Wirzberger, M.; Schmitt, T.H.; Schneider, S. A Meta-analysis of the Segmenting Effect. Educ. Psychol. Rev. 2019, 31, 389–419. [Google Scholar] [CrossRef]
- Mayer, R.E.; Wells, A.; Parong, J.; Howarth, J.T. Learner control of the pacing of an online slideshow lesson: Does segmenting help? Appl. Cognit. Psychol. 2019, 33, 930–935. [Google Scholar] [CrossRef]
- Schneider, S.; Beege, M.; Nebel, S.; Rey, G.D. A meta-analysis of how signaling affects learning with media. Educ. Res. Rev. 2018, 23, 1–24. [Google Scholar] [CrossRef]
- Mayer, R.E.; Fiorella, L. Principles for Reducing Extraneous Processing in Multimedia Learning: Coherence, Signaling, Redundancy, Spatial Contiguity, and Temporal Contiguity Principles. In The Cambridge Handbook of Multimedia Learning, 2nd ed.; Mayer, R.E., Ed.; Cambridge University Press: Cambridge, UK, 2014; pp. 279–315. ISBN 978-113-954-736-9. [Google Scholar]
- Ayres, P.; Sweller, J. The Split-Attention Principle in Multimedia Learning. In The Cambridge Handbook of Multimedia Learning, 2nd ed.; Mayer, R.E., Ed.; Cambridge University Press: Cambridge, UK, 2014; pp. 206–226. ISBN 978-113-954-736-9. [Google Scholar]
- Sweller, J. Cognitive Load Theory. In The Psychology of Learning and Motivation, 55, Cognition in Education; Mestre, J.P., Ross, B.H., Eds.; Academic Press: San Diego, CA, USA, 2011; pp. 37–76. ISBN 978-012-387-691-1. [Google Scholar]
- Schnotz, W. Integrated Model of Text and Picture Comprehension. In The Cambridge Handbook of Multimedia Learning, 2nd ed.; Mayer, R.E., Ed.; Cambridge University Press: Cambridge, UK, 2014; pp. 72–103. ISBN 978-113-954-736-9. [Google Scholar]
- Schnotz, W.; Mengelkamp, C.; Baadte, C.; Hauck, G. Focus of attention and choice of text modality in multimedia learning. Eur. J. Psychol. Educ. 2014, 29, 483–501. [Google Scholar] [CrossRef]
- Kulgemeyer, C. A Framework of Effective Science Explanation Videos Informed by Criteria for Instructional Explanations. Res. Sci. Educ. 2020, 50, 2441–2462. [Google Scholar] [CrossRef]
- Spanjers, I.A.E.; van Gog, T.; Wouters, P.; van Merriënboer, J.J.G. Explaining the segmentation effect in learning from animations: The role of pausing and temporal cueing. Comput. Educ. 2012, 59, 274–280. [Google Scholar] [CrossRef]
- Guo, P.J.; Juho, K.; Rob, R. How video production affects student engagement: An empirical study of MOOC videos. In Proceedings of the L@S 2014: First (2014) ACM Conference on Learning @ Scale, Atlanta, GA, USA, 4–5 March 2014; pp. 41–50, ISBN 978-145-032-669-8. [Google Scholar]
- Ouwehand, K.; van Gog, T.; Paas, F. Designing effective video-based modeling examples using gaze and gesture cues. Educ. Technol. Soc. 2015, 18, 78–88. [Google Scholar]
- Van Wermeskerken, M.; Ravensbergen, S.; van Gog, T. Effects of instructor presence in video modeling examples on attention and learning. Comput. Hum. Behav. 2018, 89, 430–438. [Google Scholar] [CrossRef]
- Hertwig, R.; Benz, B.; Krauss, S. The conjunction fallacy and the many meanings of and. Cognition 2008, 108, 740–753. [Google Scholar] [CrossRef] [PubMed] [Green Version]
- Böcherer-Linder, K.; Eichler, A.; Vogel, M. Die Formel von Bayes: Kognitionspsychologische Grundlagen und empirische Untersuchungen zur Bestimmung von Teilmenge-Grundmenge-Beziehungen. J. Math. Didakt. 2018, 39, 127–146. [Google Scholar] [CrossRef]
- Rushdi, A.M.A.; Serag, H.A.M. Solutions of Ternary Problems of Conditional Probability with Applications to Mathematical Epidemiology and the COVID-19 Pandemic. Int. J. Math. Eng. Manag. Sci. 2020, 5, 787–811. [Google Scholar] [CrossRef]
- Batanero, C.; Borovcnik, M. Statistics and Probability in High School; SensePublishers: Rotterdam, The Netherlands, 2016; ISBN 978-946-300-624-8. [Google Scholar]
- Díaz, C.; Batanero, C. University Students’ Knowledge and Biases in Conditional Probability Reasoning. Int. Elect. J. Math. Ed. 2009, 4, 131–162. [Google Scholar] [CrossRef]
- Mathan, S.; Koedinger, K.R. Recasting the Feedback Debate: Benefits of Tutoring Error Detection and Correction Skills. In Artificial Intelligence in Education: Shaping the Future of Learning through Intelligent Technologies; Hoppe, U., Verdejo, F., Kay, J., Eds.; IOS Press: Amsterdam, The Netherlands, 2003; pp. 13–149. ISBN 978-158-603-356-9. [Google Scholar]
- Binder, K.; Krauss, S.; Wiesner, P. A New Visualization for Probabilistic Situations Containing Two Binary Events: The Frequency Net. Front. Psychol. 2020, 11, 750. [Google Scholar] [CrossRef]
- Bruckmaier, G.; Binder, K.; Krauss, S.; Kufner, H.-M. An Eye-Tracking Study of Statistical Reasoning with Tree Diagrams and 2 × 2 Tables. Front. Psychol. 2019, 10, 632. [Google Scholar] [CrossRef]
- Gigerenzer, G.; Multmeier, J.; Föhring, A.; Wegwarth, O. Do children have Bayesian intuitions? J. Exp. Psychol. Gen. 2021, 150, 1041–1070. [Google Scholar] [CrossRef] [PubMed]
- Hoffrage, U.; Gigerenzer, G. Using natural frequencies to improve diagnostic inferences. Acad. Med. 1998, 73, 538–540. [Google Scholar] [CrossRef] [PubMed]
- Barbieri, C.A.; Booth, J.L. Mistakes on Display: Incorrect Examples Refine Equation Solving and Algebraic Feature Knowledge. Appl. Cogn. Psychol. 2020, 34, 862–878. [Google Scholar] [CrossRef]
- Loibl, K.; Rummel, N. Knowing what you don’t know makes failure productive. Learn. Instr. 2014, 34, 74–85. [Google Scholar] [CrossRef]
- Dick, W. Formative Evaluation. In Instructional Design: Principles and Applications; Briggs, L.J., Ackermann, A.S., Eds.; Educational Technology Publications: Englewood Cliffs, NJ, USA, 1977; pp. 311–336. ISBN 978-087-778-098-4. [Google Scholar]
- Ashdown, H.F.; Fleming, S.; Spencer, E.A.; Thompson, M.J.; Stevens, R.J. Diagnostic accuracy study of three alcohol breathalysers marketed for sale to the public. BMJ Open 2014, 4, e005811. [Google Scholar] [CrossRef] [PubMed] [Green Version]
- Steib, N.; Büchter, T.; Eichler, A.; Krauss, S.; Binder, K.; Böcherer-Linder, K.; Vogel, M. How to boost performance and communication in Bayesian situations among future physicans and legal practitioners—A comparison of four training programs. submitted.
- Büchter, T.; Steib, N.; Krauss, S.; Eichler, A.; Binder, K.; Böcherer-Linder, K.; Vogel, M. A new take on Bayesian Reasoning: Teaching understanding of covariation. submitted.
- Bayesian Reasoning. Available online: http://bayesianreasoning.de/en/bayes_en.html (accessed on 14 March 2022).
Figure 1.
Double tree diagram, unit square and icon array as visualizations of a Bayesian situation.
Figure 1.
Double tree diagram, unit square and icon array as visualizations of a Bayesian situation.

Figure 2.
Examples of learning tasks for medicine and law, respectively.

Figure 3.
Representations of a Bayesian situation, which serve as mental models for performance.

Figure 4.
Implementation of multimedia principles (segmenting, signaling, temporal and spatial contiguity) in one slide within step 2 (add frequencies). Firstly, the new text appears (lowest bullet point on the left-hand side) followed by the new element in the visualization (new number on the right-hand side). Corresponding features are highlighted in purple.

Figure 5.
Summaries after each step within the worked example for the double tree and unit square.

Figure 6.
Mental models for the aspect of covariation.

Figure 7.
Screenshots from the three explanatory videos in ascending complexity.

Figure 8.
Screenshot of the procedural information on different kinds of probabilities. Other aspects of procedural information can be seen as well: the visualizations are hand-drawn, and the textual phrasing of the probability is complemented by a wording of proportions.
Figure 8.
Screenshot of the procedural information on different kinds of probabilities. Other aspects of procedural information can be seen as well: the visualizations are hand-drawn, and the textual phrasing of the probability is complemented by a wording of proportions.

Figure 9.
Corrective feedback on the procedural aspect of how to create the visualization.

Figure 10.
Screenshot of the explanatory video on changes in the false-positive rate including a table of the visualization (here: unit square) with the visualized fraction for the values of 0%, 50% and 100% of the false-positive rate. This is available in the legend while working on the task of covariation.

Figure 11.
Notes of the students while working on the learning task on the aspect of performance (after having gone through the supportive information).
Figure 11.
Notes of the students while working on the learning task on the aspect of performance (after having gone through the supportive information).

Figure 12.
The students’ notes while working on the learning task on the aspect of covariation.


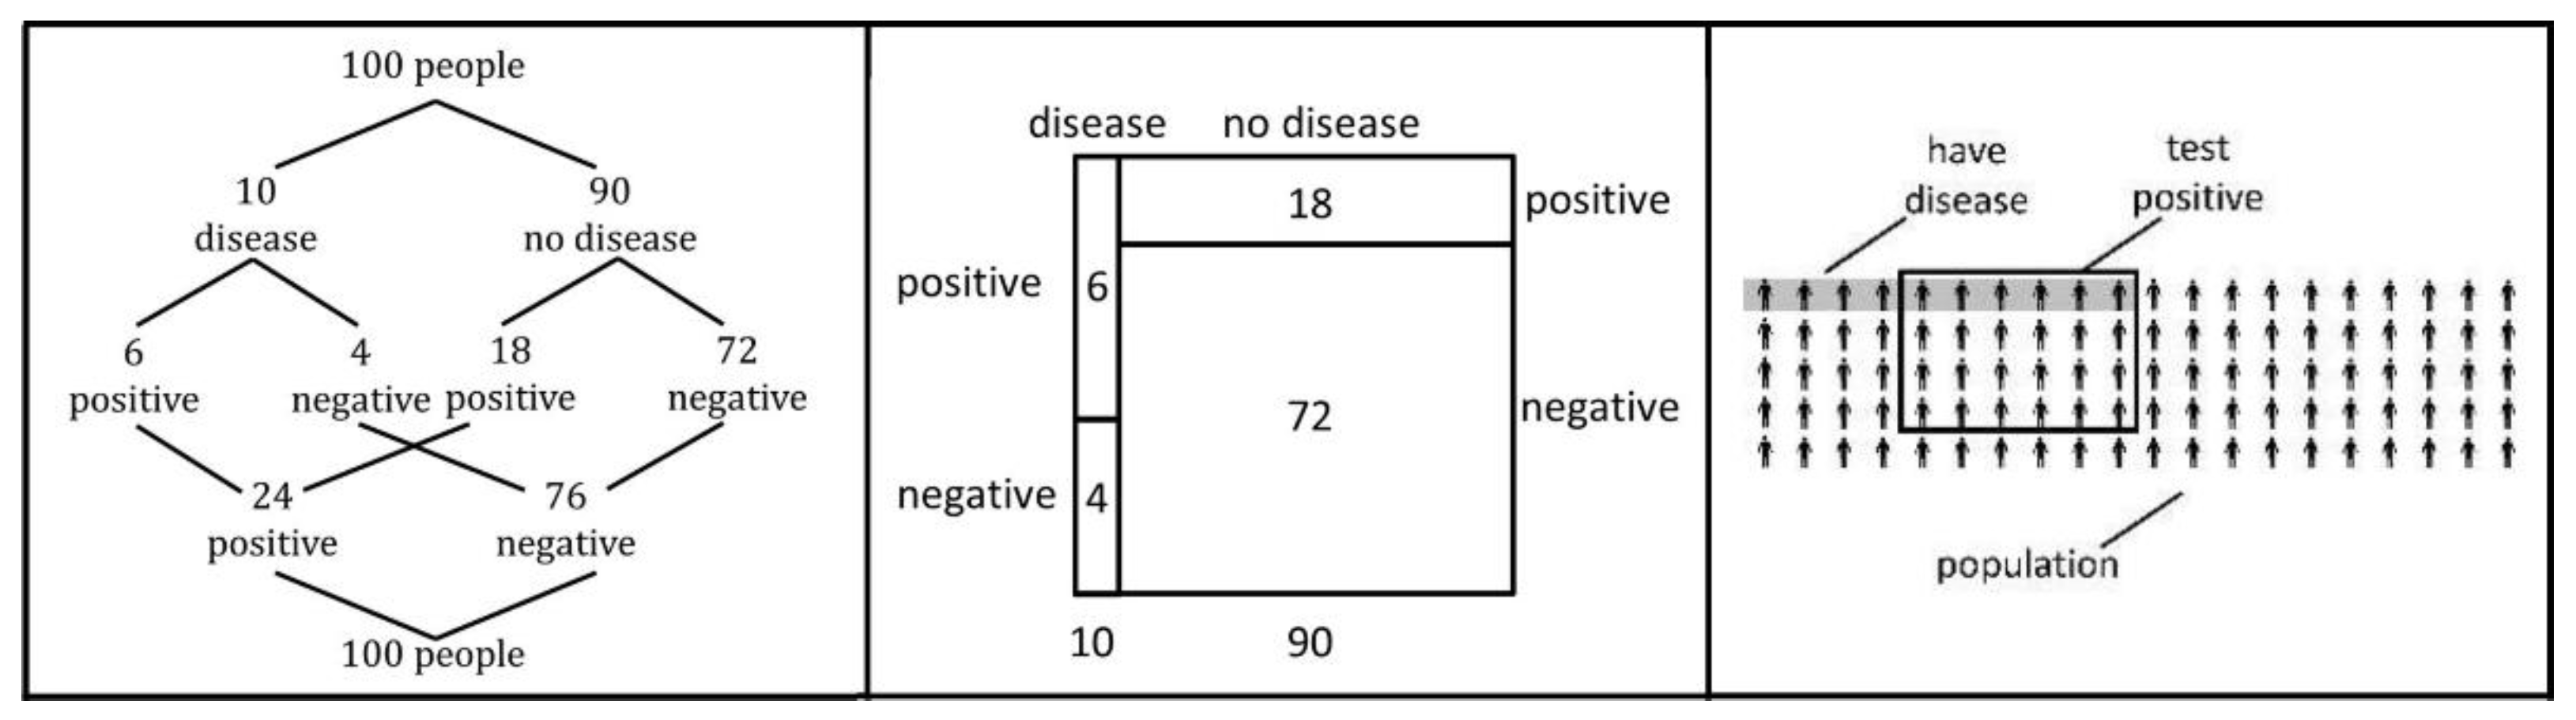
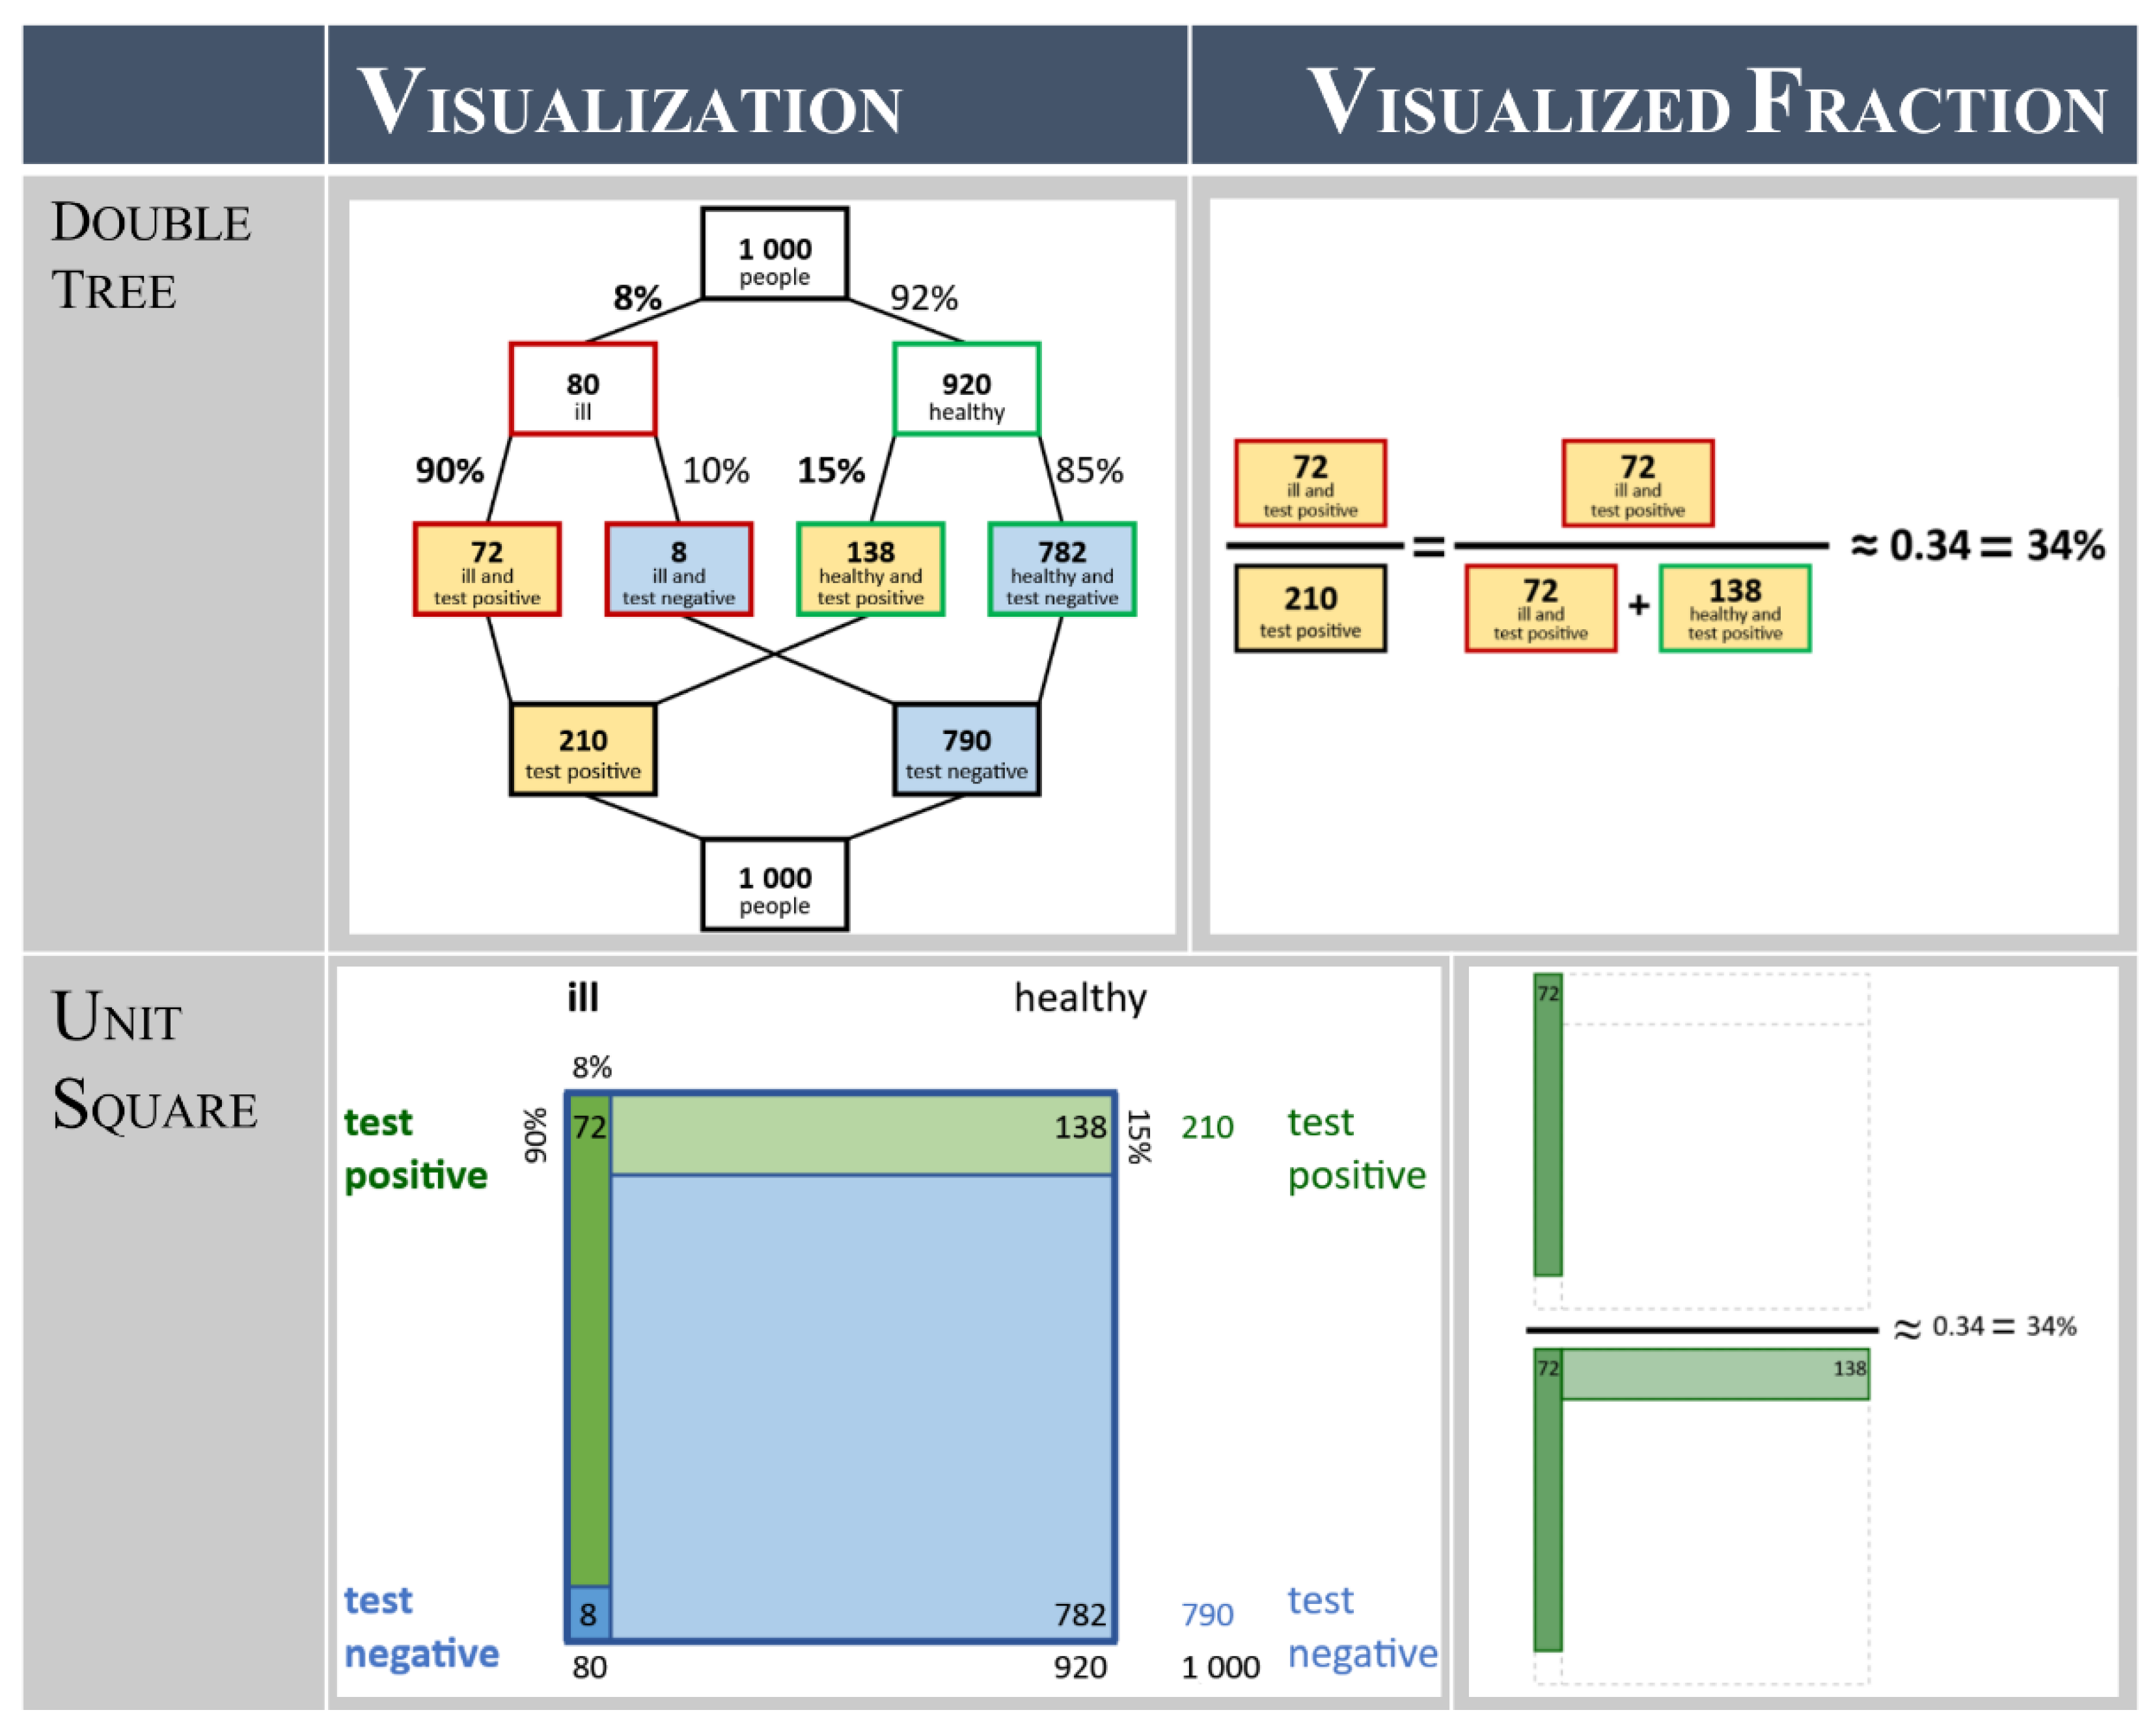
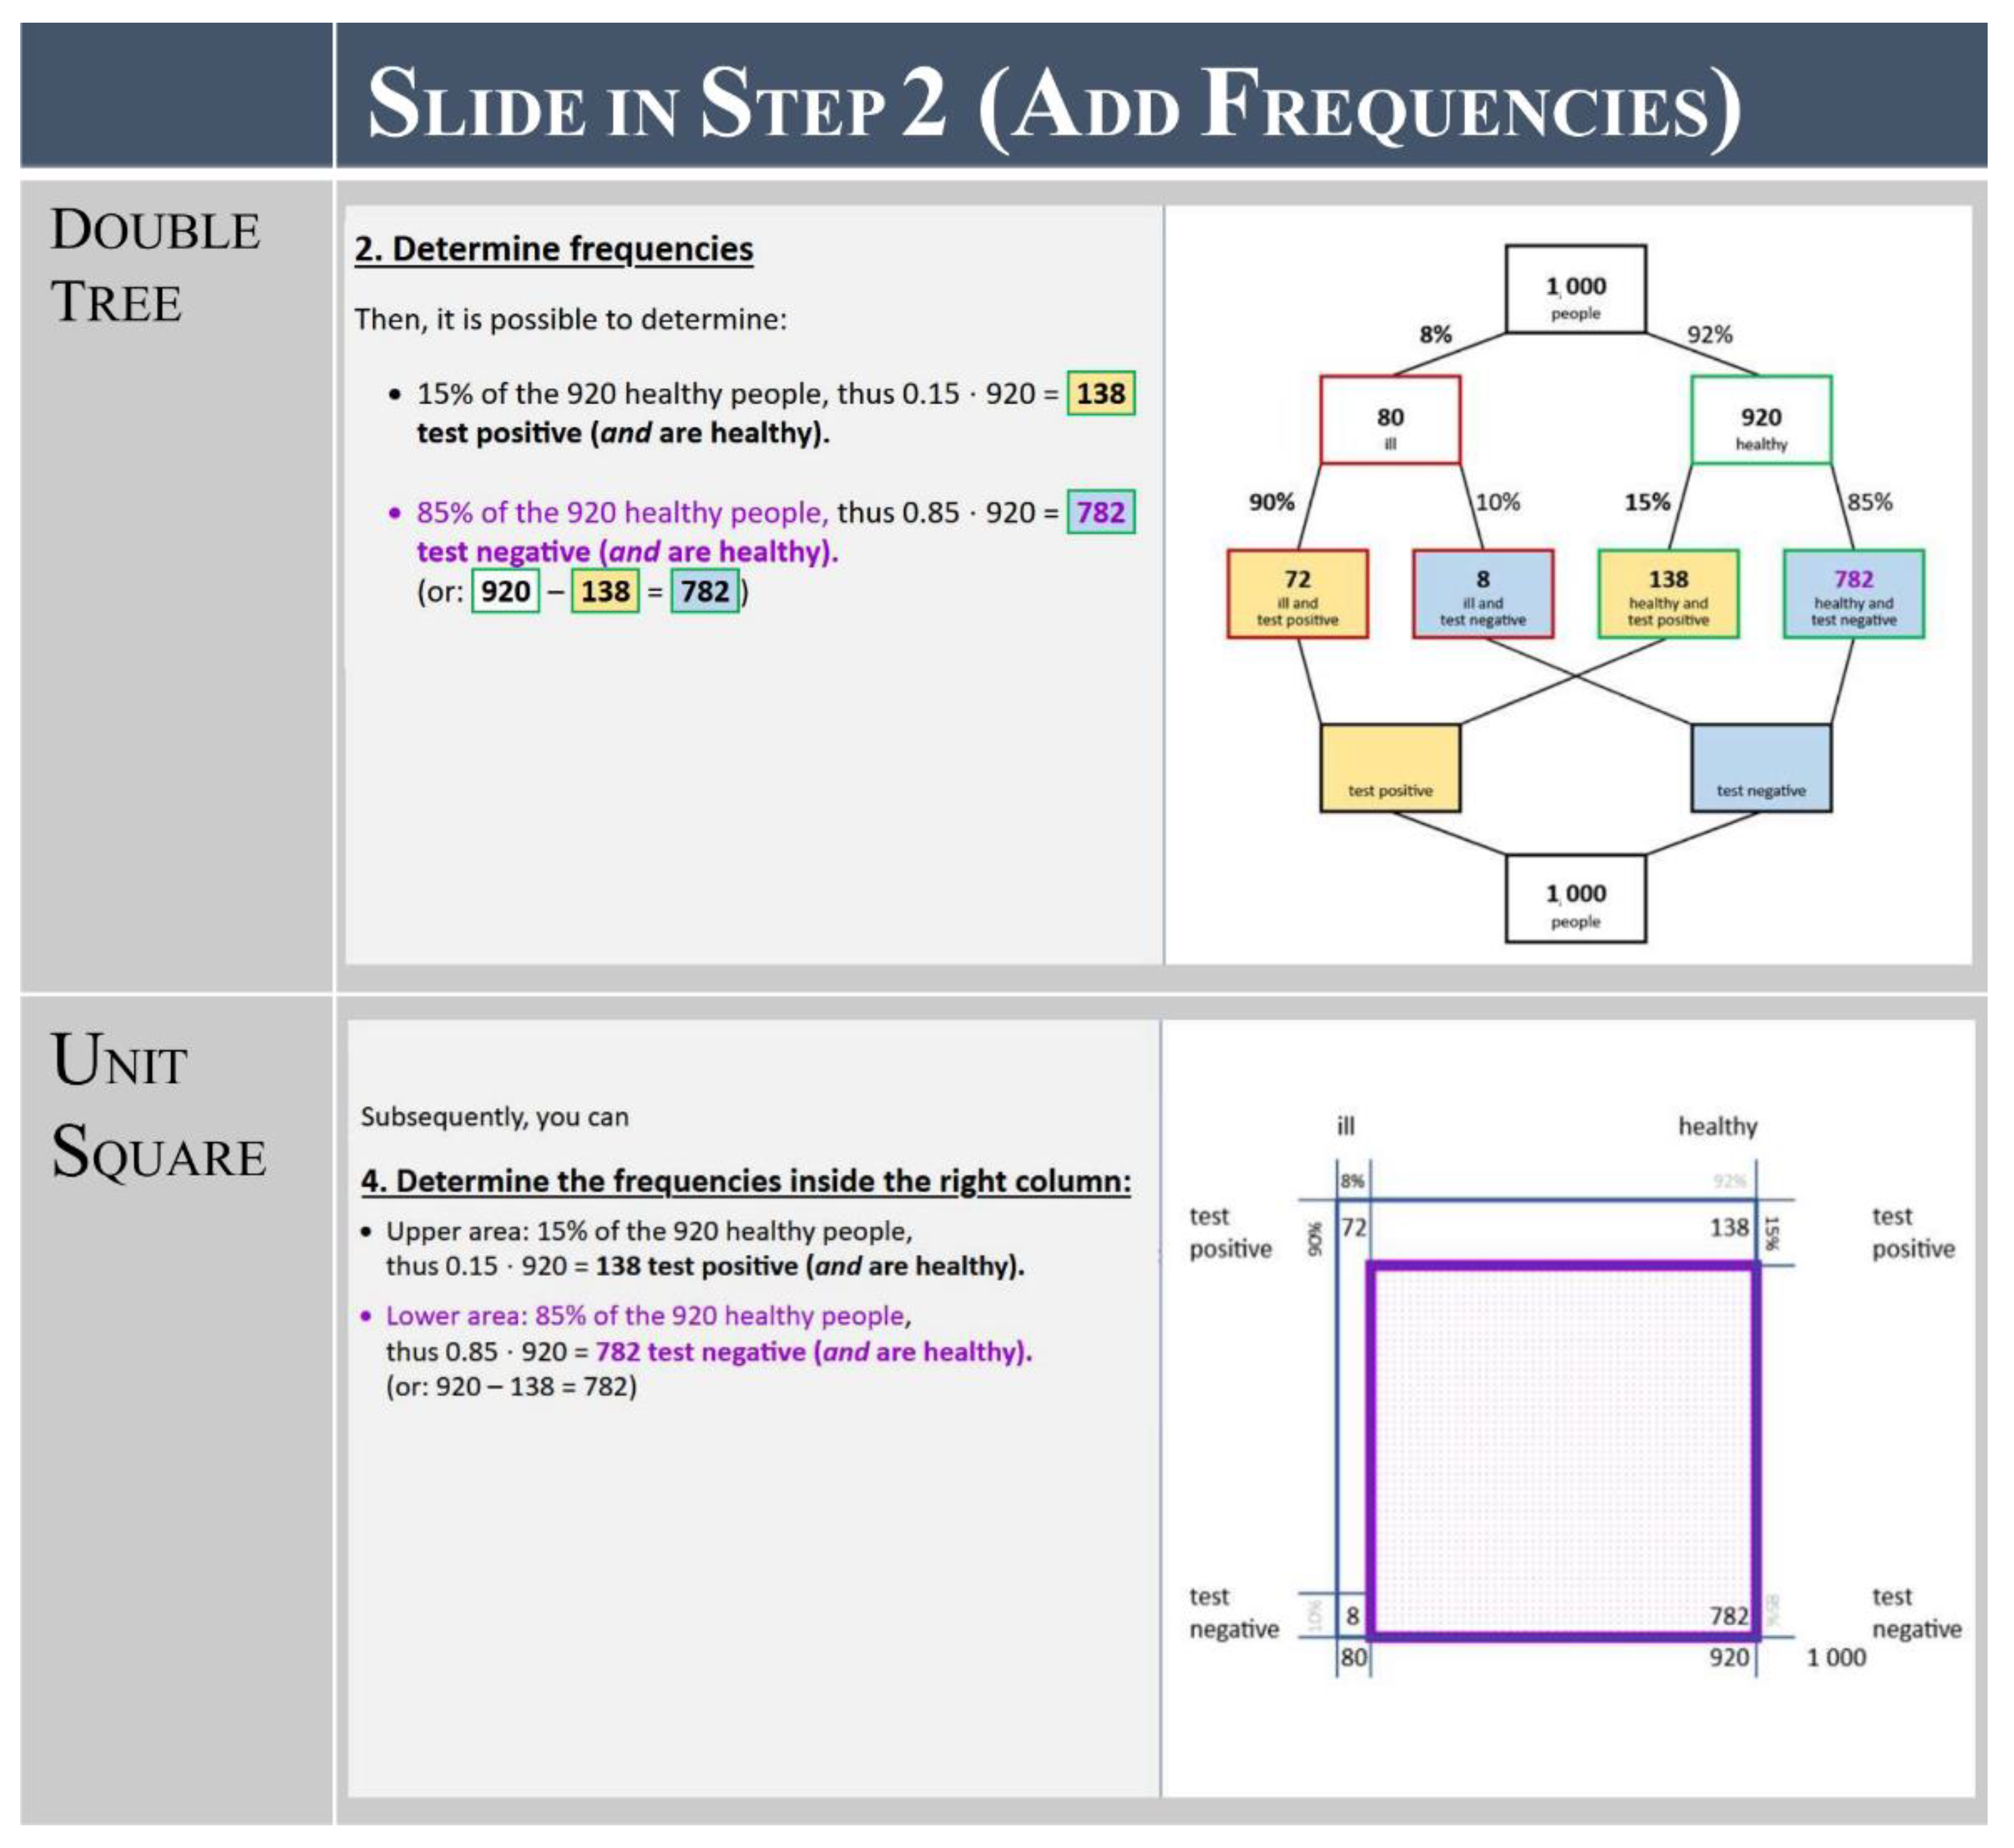
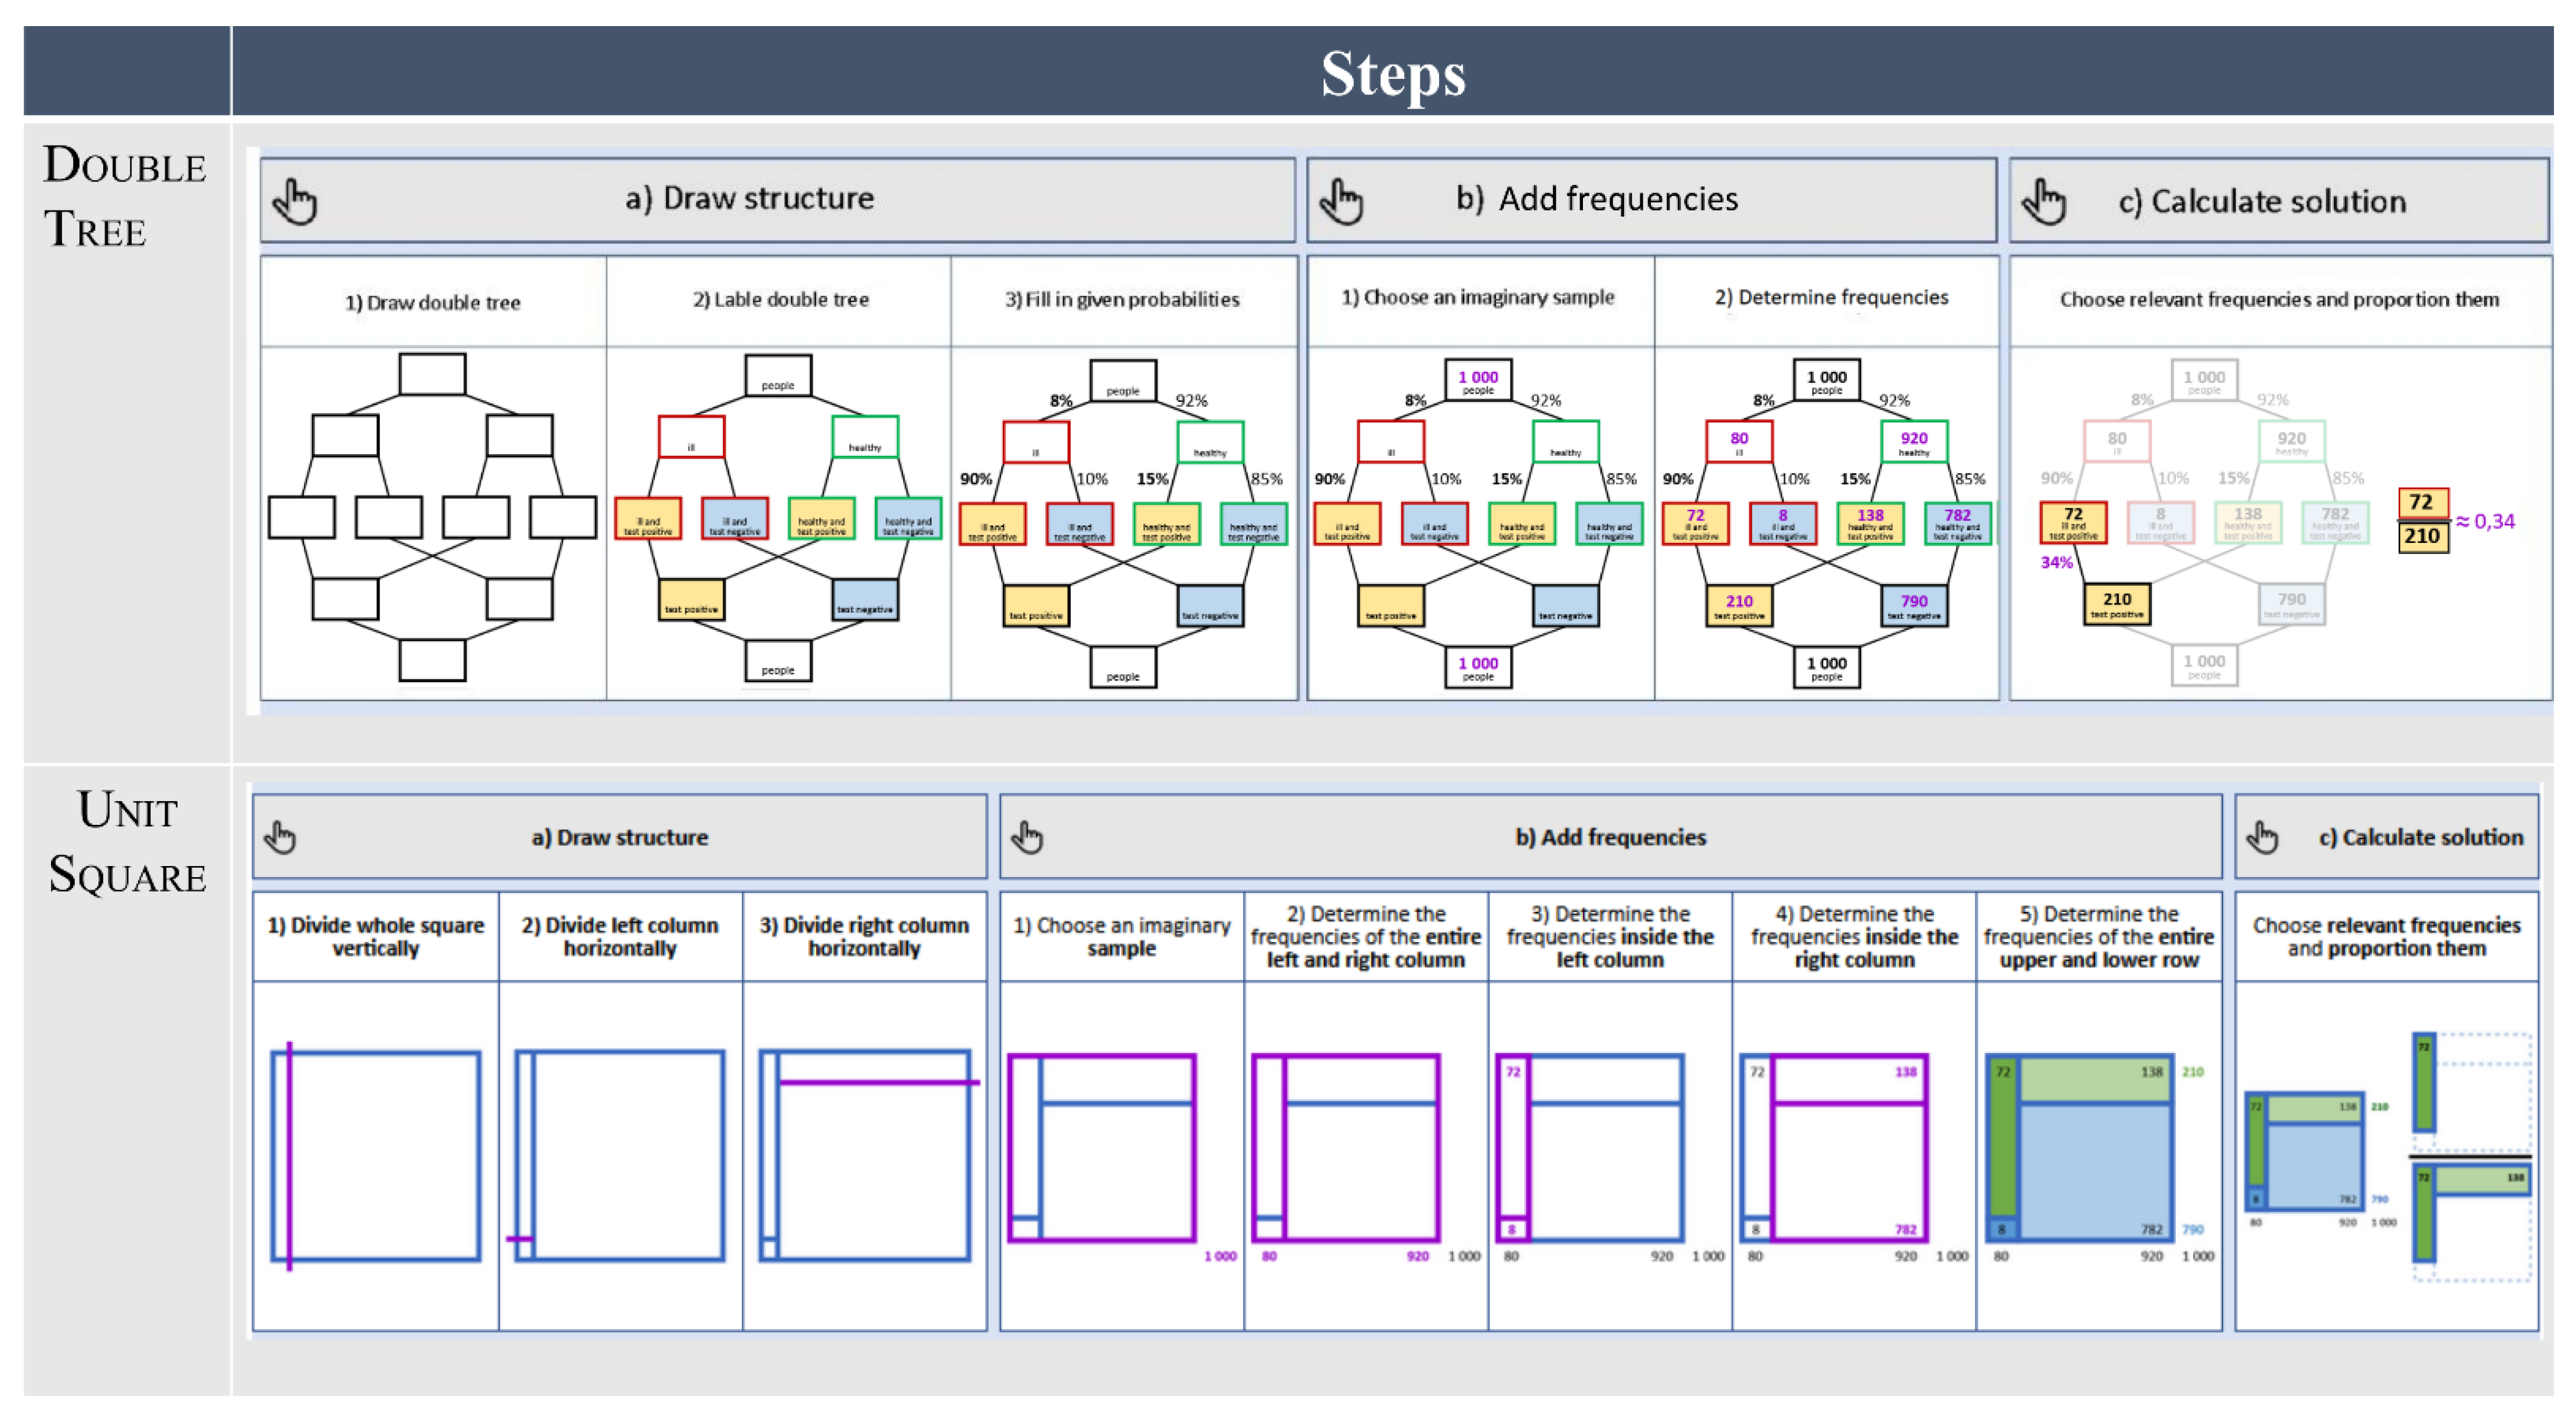
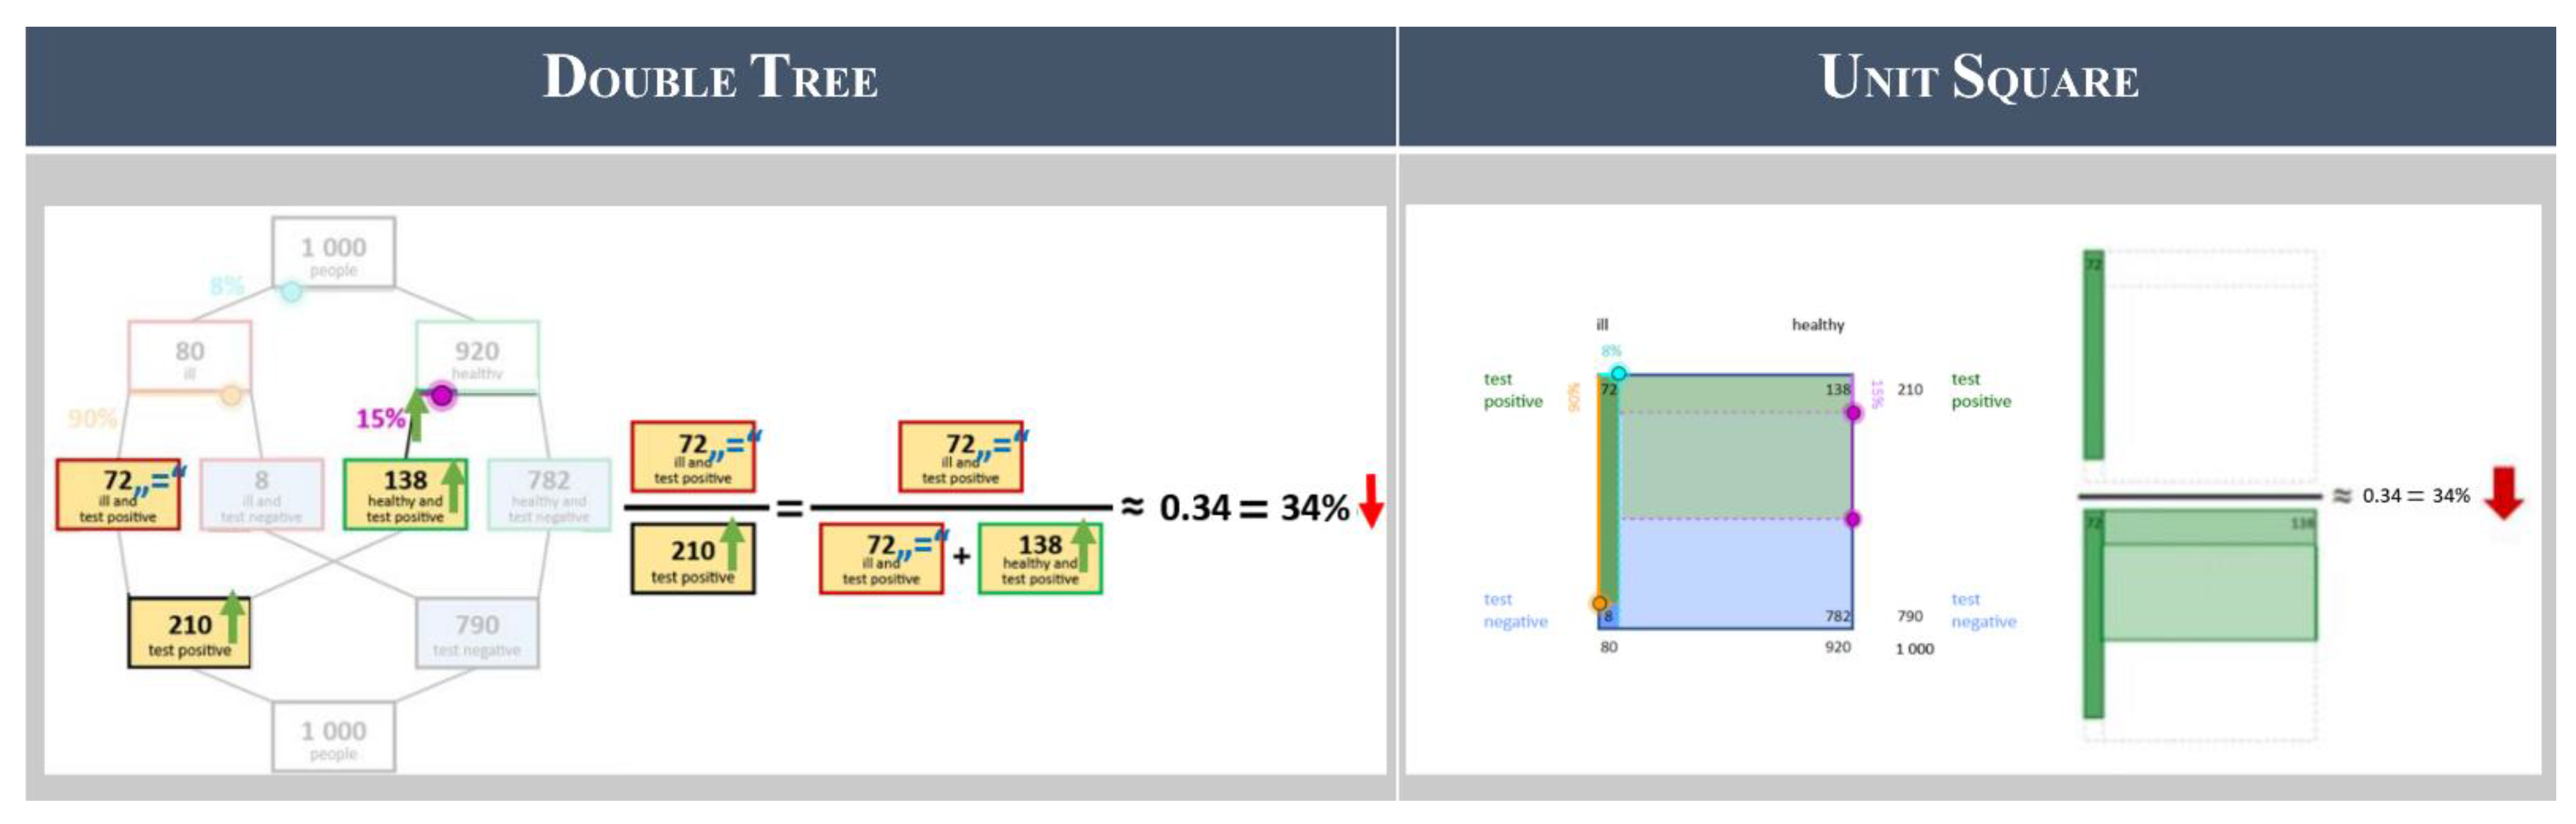
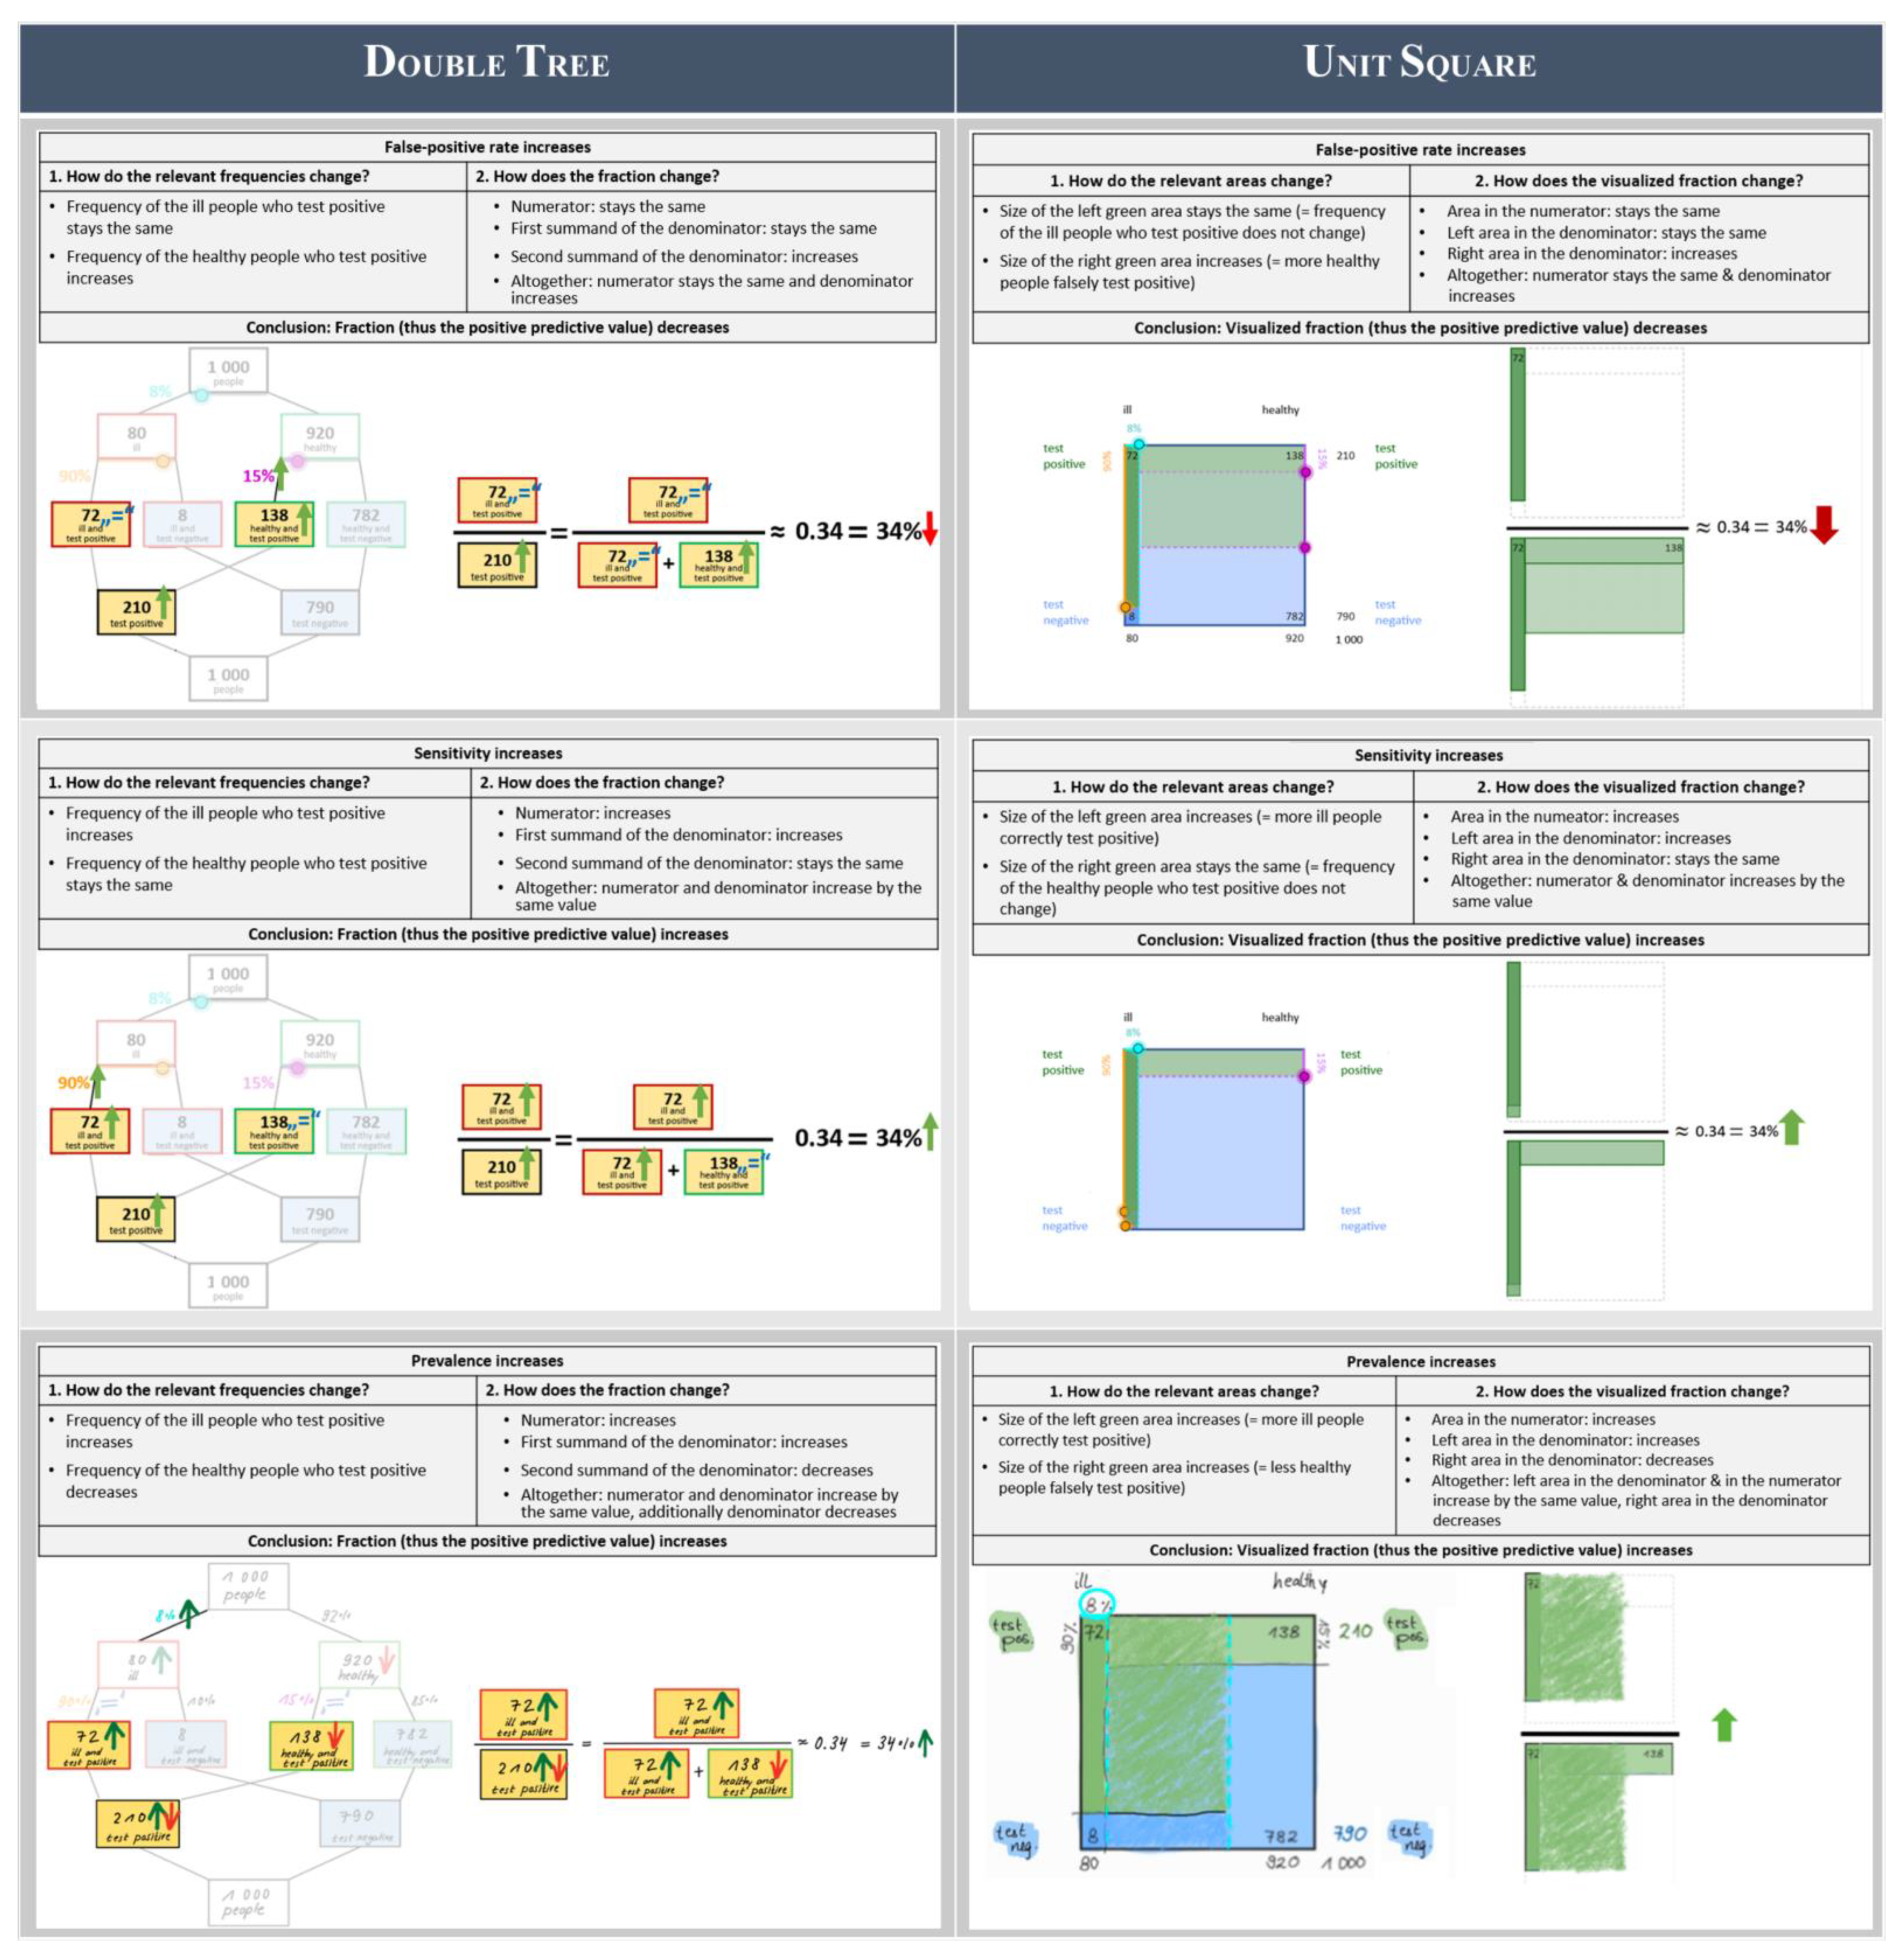
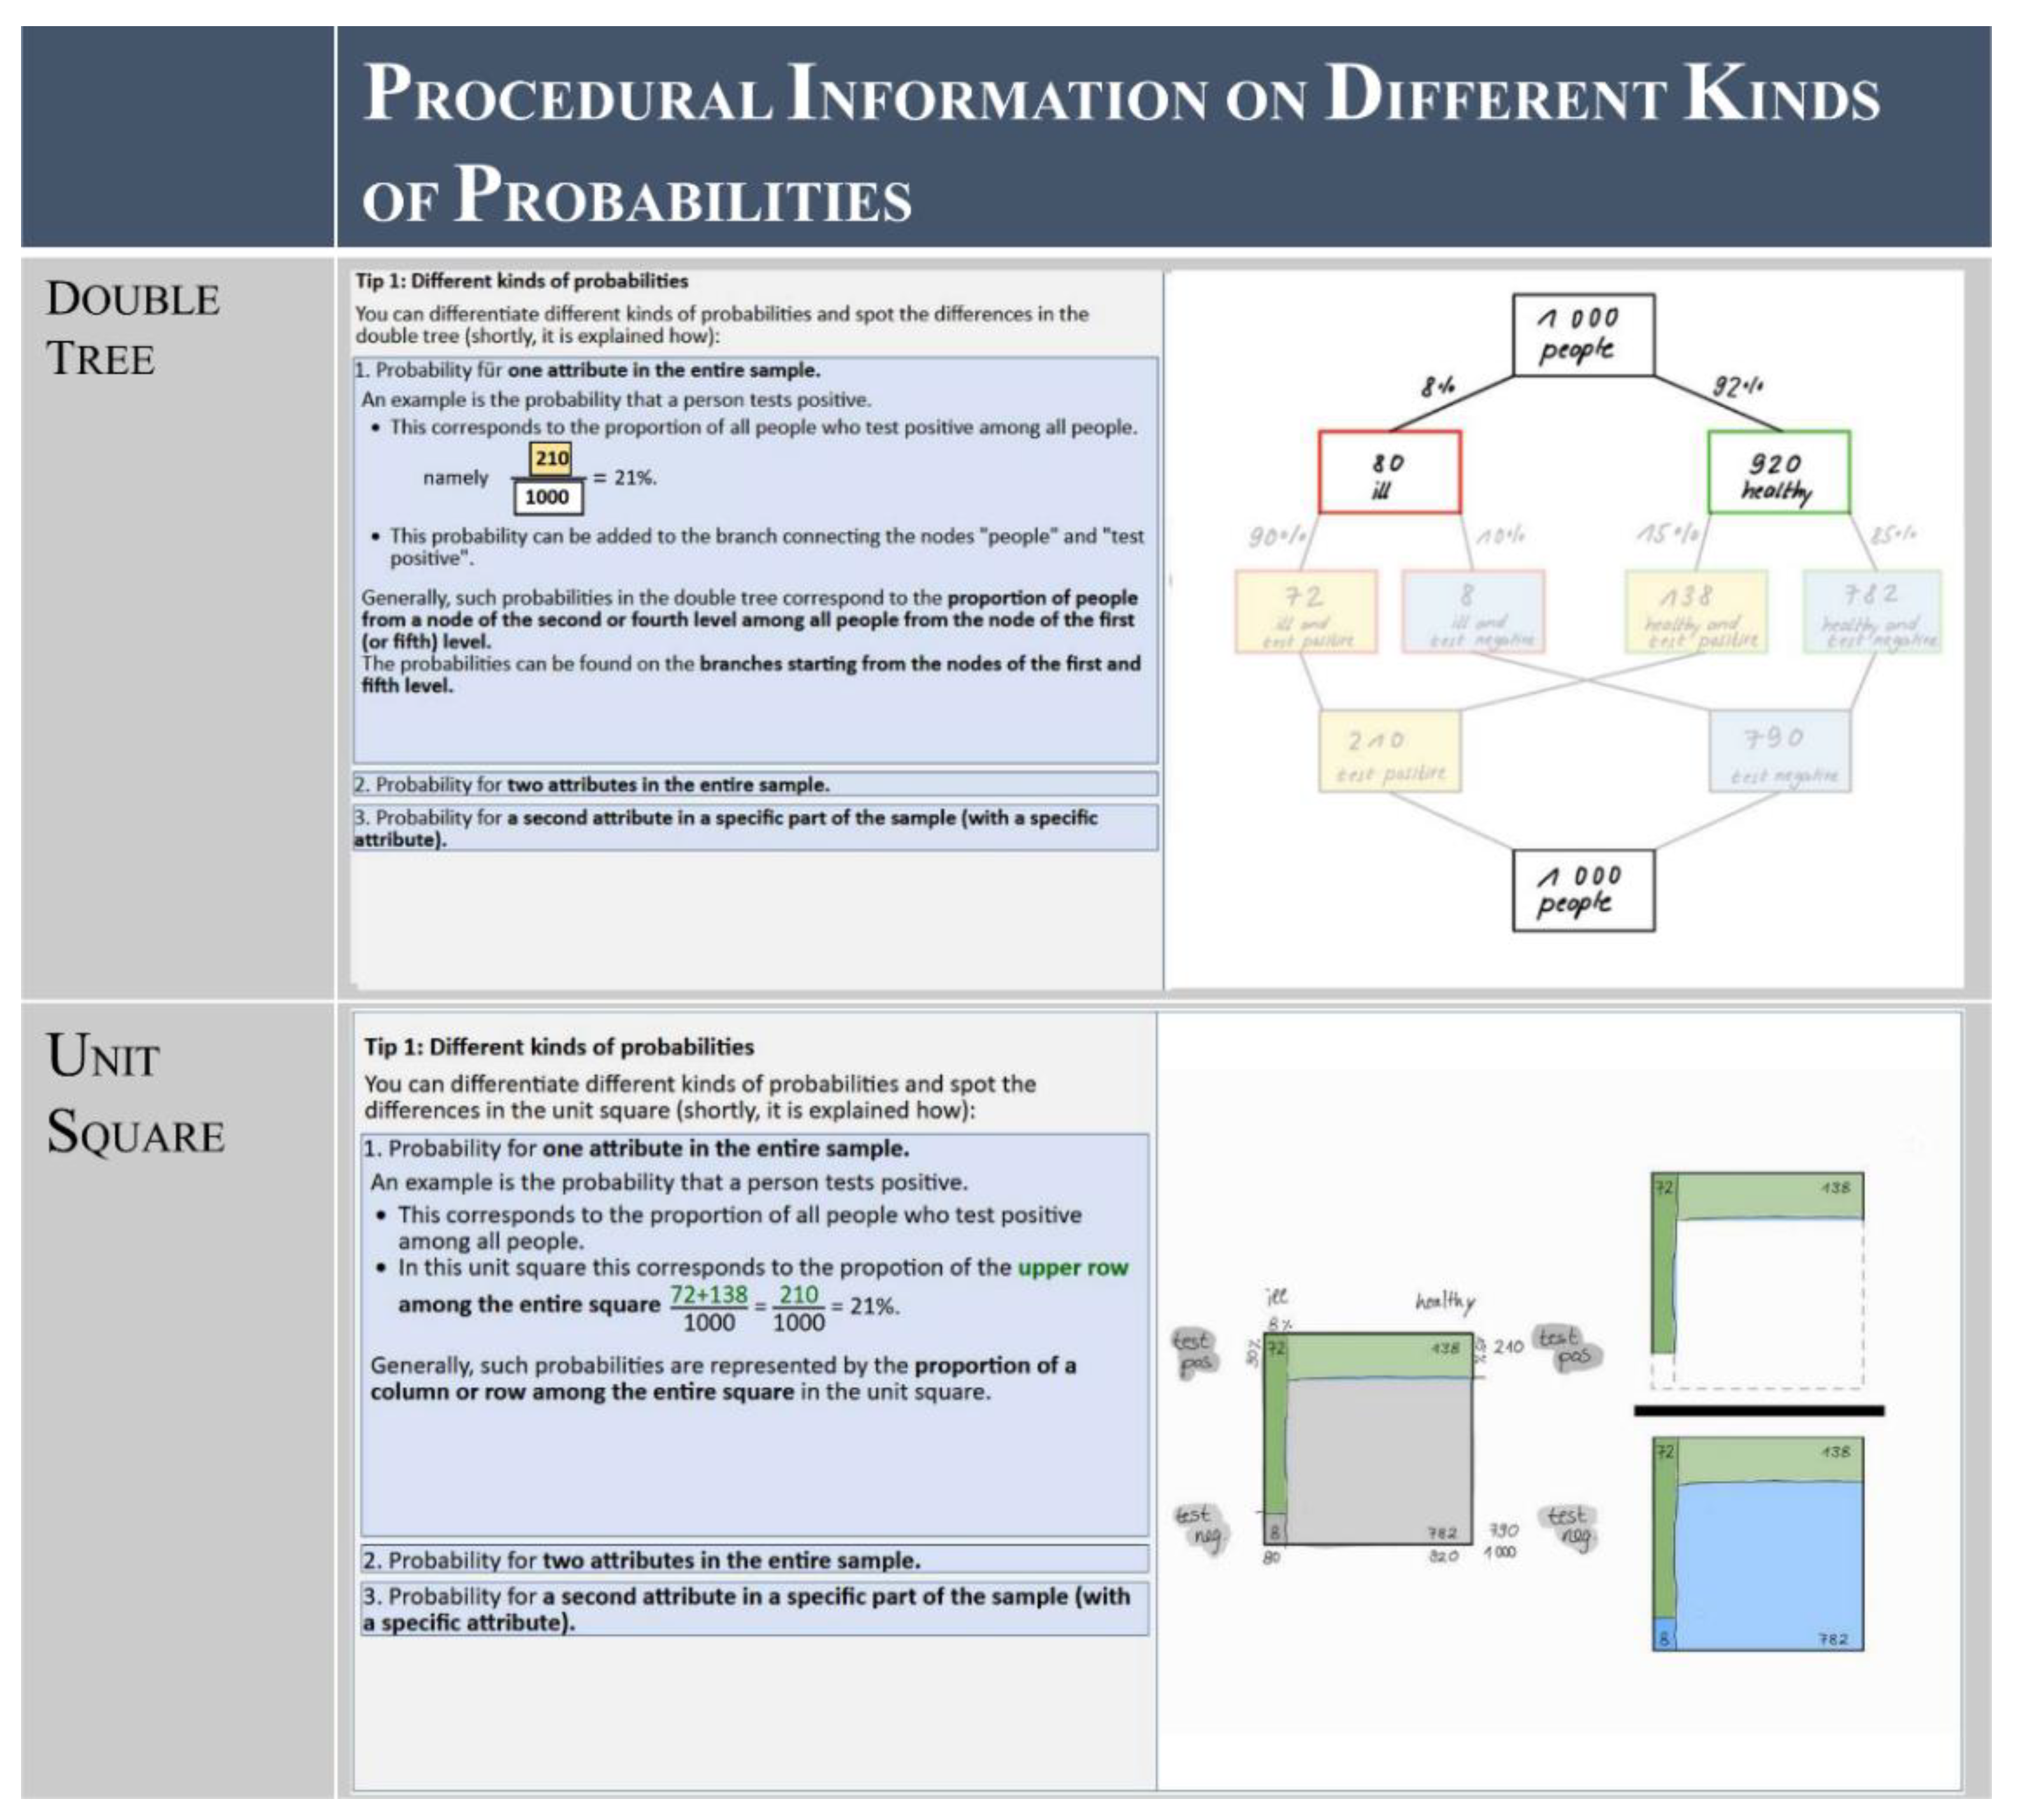
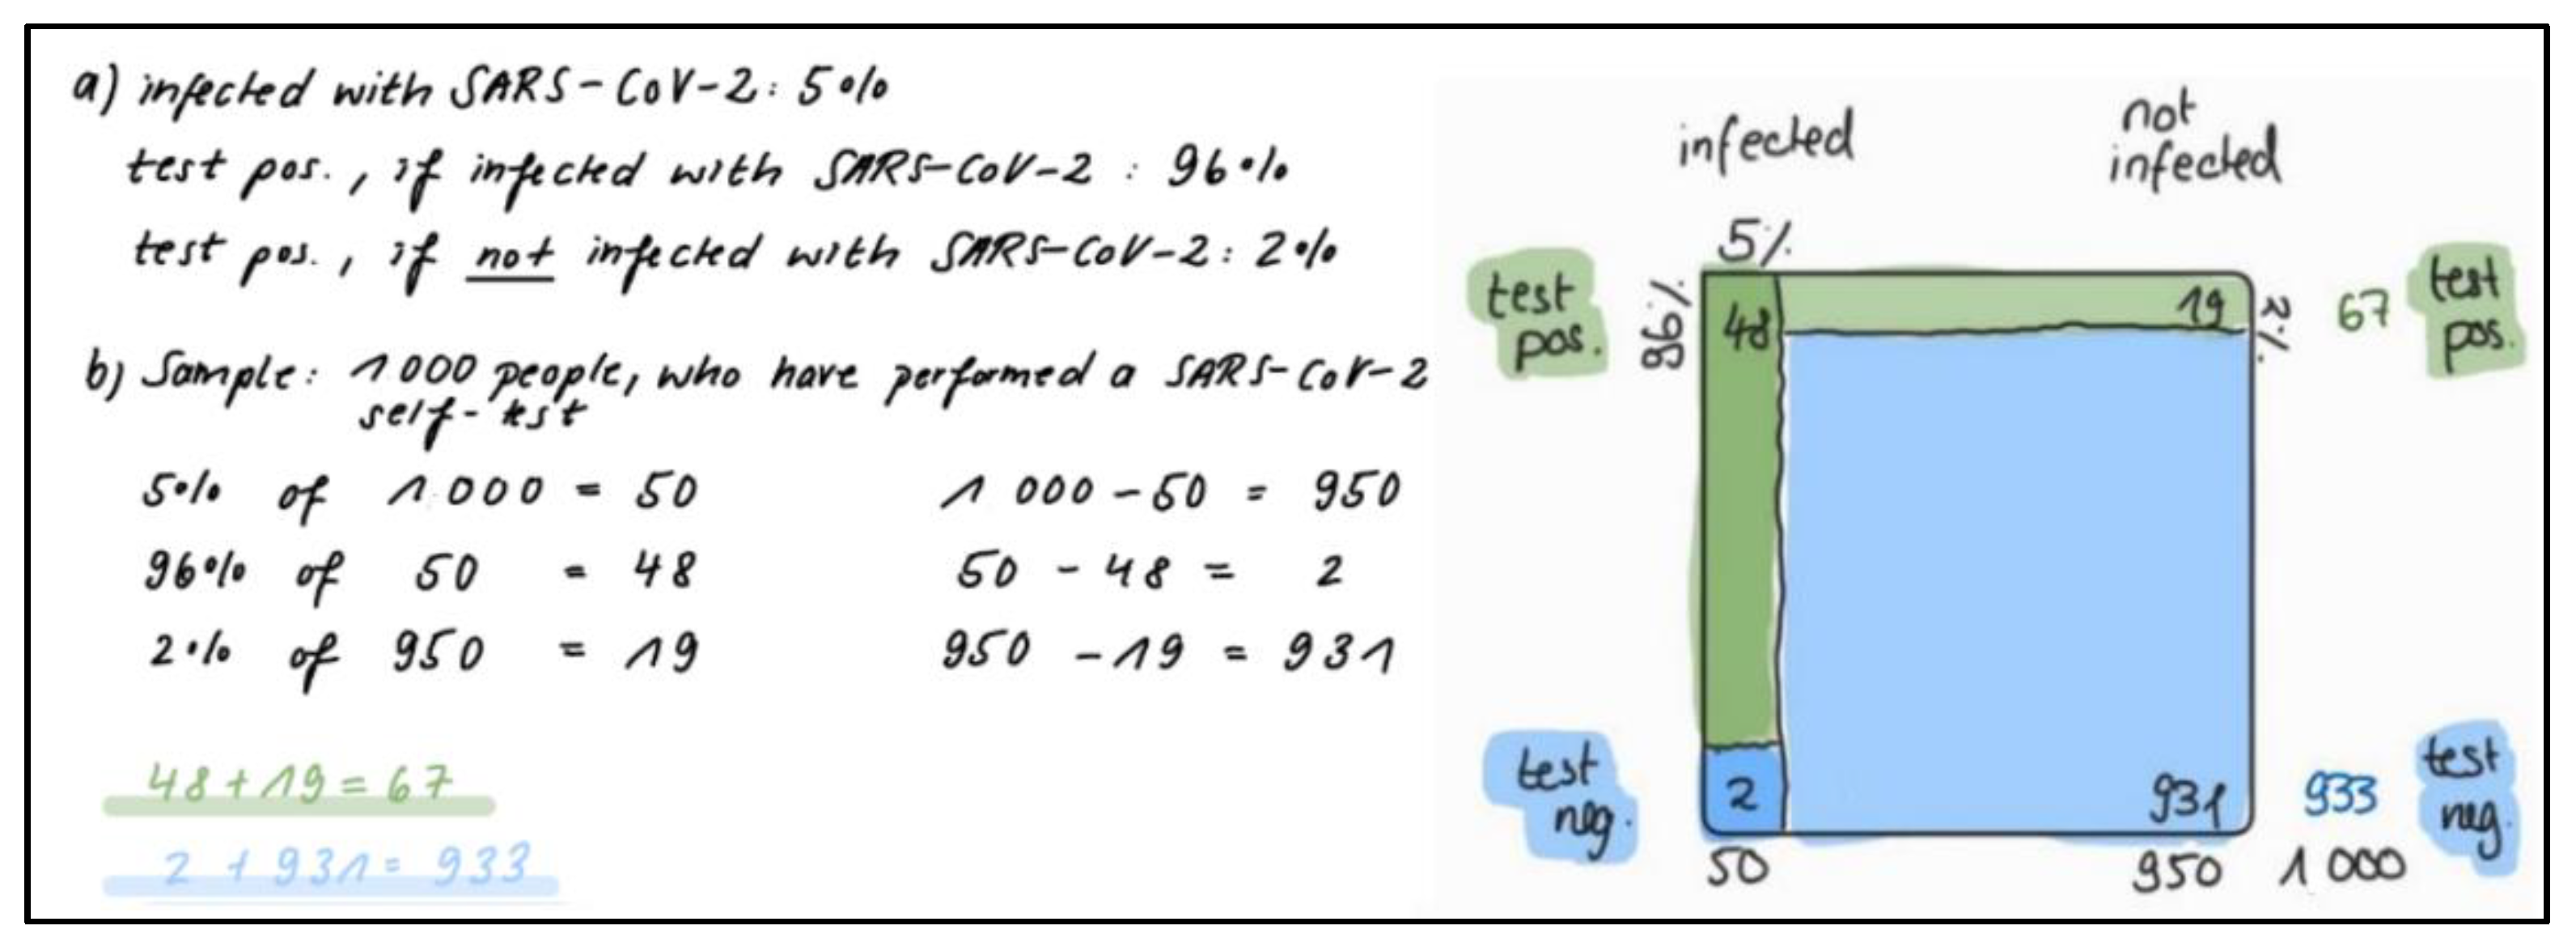
Table 1.
Overview of training initiatives [16,20,44,45,46,47,48,49,50,51,52] for Bayesian Reasoning.
| Researchers | Year of Publication | Sample | Characteristics of the Training Course |
|---|---|---|---|
| Bea [44] | 1995 | n = 289 economic students | Duration: 50 min Information format: probabilities Visualization: tree diagram, inverse tree diagram, unit square |
| Chow and Van Haneghan [45] | 2016 | n = 121 university students | Duration: 15 min Information format: probabilities and frequencies Visualization: tree diagram |
| Hoffrage et al. [16] | 2015 | n = 78 medicine students | Duration: not given Information format: probabilities and frequencies Visualization: tree diagram |
| Kurzenhäuser and Hoffrage [46] | 2002 | n = 208 medicine students | Duration: 60 min Information format: natural frequencies Visualization: tree diagram |
| Ruscio [47] | 2003 | n = 113 psychology students | Duration: 45 min Information format: probabilities and frequencies Visualization: tree diagram, frequency grid, 2 × 2 table |
| Sedlmeier and Gigerenzer [48] | 2001 | n = 86 university students | Duration: 60 min Information format: probabilities and frequencies Visualization: tree diagram, frequency grid |
| Sirota et al. [49] | 2015 | n = 114 social science students | Duration: 30 min Information format: probabilities and frequencies Visualization: tree diagram, Euler diagram |
| Starns et al. [49] | 2019 | n = 174 university students | Duration: <10 min Information format: probabilities Visualization: bar visualization technique |
| Steckelberg et al. [50] | 2004 | n = 184 university students | Duration: 120 min Information format: frequencies Visualization: tree diagram, 2 × 2 table |
| Talboy and Schneider [51] | 2017 | n = 213 psychology students | Duration: <10 min Information format: frequencies Visualization: 2 × 2 table, unit square |
| Wassner [52] | 2007 | n = 127 students in school | Duration: 120 min Information format: probabilities and frequencies Visualization: tree diagram |
Table 2.
Number of correct responses in the four phases of the formative evaluation (number of all students who worked on the task is given in brackets). L1–L5 refer to the 5 different learning tasks that were used here (compare Section 3.1). T1 refers to a learning task that was about a topic outside of one’s own domain (e.g., law context for students of medicine and medical context for students of law). Within the tasks on the aspect of covariation, C1 refers to changes in the false-positive rate, C2 to changes in the true-positive rate and C3 to changes in the base rate.
| Students’ Correct Responses (Among All Answers) in the Four Phases | |||||||||||||||||
|---|---|---|---|---|---|---|---|---|---|---|---|---|---|---|---|---|---|
| Phase | Phase 1 | Phase 2 | Phase 3 | Phase 4 | |||||||||||||
| Aspect | Performance | Covariation | Performance | Covariation | Performance | Covariation | |||||||||||
| Learning task | L1 | L2 | L3 | L3-C1 | L3-C2 | L3-C3 | L3 | L3-C1 | L3-C2 | L3-C3 | L4 | L5 | L1 | T1 | L5-C1 | L5-C2 | L5-C3 |
| Medicine | 3 (8) | 4 (8) | 5 (8) | 5 (8) | 4 (8) | 5 (8) | 7 (8) | 6 (8) | 7 (8) | 8 (8) | 7 (7) | 6 (7) | 7 (7) | 7 (7) | 7 (7) | 7 (7) | 7 (7) |
| Law | 0 (8) | 0 (8) | 3 (8) | 6 (8) | 7 (8) | 5 (8) | 6 (8) | 6 (8) | 8 (8) | 4 (8) | 4 (7) | 6 (7) | 4 (6) | 4 (6) | 6 (7) | 7 (7) | 5 (7) |
Publisher’s Note: MDPI stays neutral with regard to jurisdictional claims in published maps and institutional affiliations. |
© 2022 by the authors. Licensee MDPI, Basel, Switzerland. This article is an open access article distributed under the terms and conditions of the Creative Commons Attribution (CC BY) license (https://creativecommons.org/licenses/by/4.0/).
Share and Cite
MDPI and ACS Style
Büchter, T.; Eichler, A.; Steib, N.; Binder, K.; Böcherer-Linder, K.; Krauss, S.; Vogel, M. How to Train Novices in Bayesian Reasoning. Mathematics 2022, 10, 1558. https://doi.org/10.3390/math10091558
AMA Style
Büchter T, Eichler A, Steib N, Binder K, Böcherer-Linder K, Krauss S, Vogel M. How to Train Novices in Bayesian Reasoning. Mathematics. 2022; 10(9):1558. https://doi.org/10.3390/math10091558
Chicago/Turabian StyleBüchter, Theresa, Andreas Eichler, Nicole Steib, Karin Binder, Katharina Böcherer-Linder, Stefan Krauss, and Markus Vogel. 2022. "How to Train Novices in Bayesian Reasoning" Mathematics 10, no. 9: 1558. https://doi.org/10.3390/math10091558
Note that from the first issue of 2016, this journal uses article numbers instead of page numbers. See further details here.